Acceptance criteria and measurement uncertainty in temperature mapping

"All data points must stay between 2 and 8 °C." That is how nearly every mapping protocol phrases it. And it is not quite right, because your data loggers have their own margin of error. On this page we explain in plain language how measurement uncertainty (the MPE of your logger) works, what an acceptance limit really is, and how you calculate it with one simple subtraction. With worked examples you can drop straight into your protocol.

How does the guard band work?

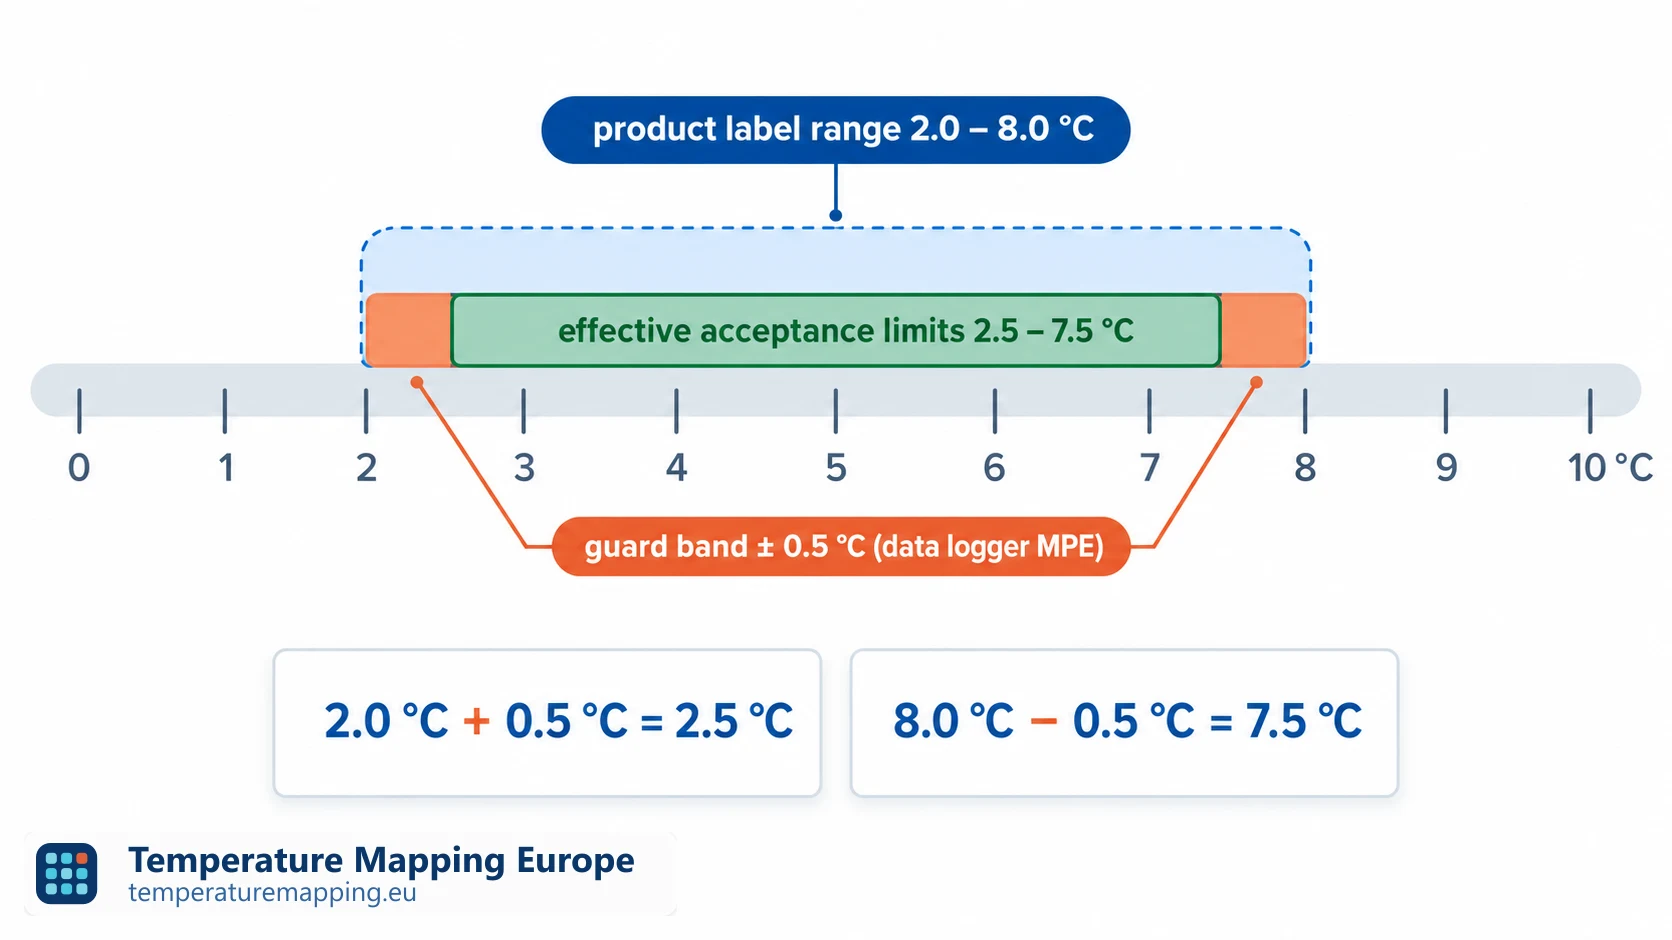
Cold room 2–8 °C, logger with MPE ±0.50 °C

1 2 4 6 8 9 2 °C 8 °C 2.50 7.50 Acceptance limit mapping data must stay inside GB GB 0.50 °C 0.50 °C
Label range 2–8 °C Guard band Acceptance limit
Short answer

Your acceptance limit is stricter than the label range of the product. You subtract the MPE (Maximum Permissible Error) of your logger from both sides. That is called a guard band. What remains is the range within which every mapping data point must fall in order to claim that the space stayed within the label range. For a 2 to 8 °C cold room with a ±0.5 °C logger, your acceptance limit becomes 2.50 to 7.50 °C. You then use the same reasoning to derive the alarm limits for your fixed monitoring.

In brief

  • The label range of your product (for example 2 to 8 °C) is not your acceptance limit. You have to measure more strictly in order to claim that you stayed within that range.
  • Every data logger has an MPE (Maximum Permissible Error): the maximum error the manufacturer guarantees across the calibration period. For a decent logger, this is typically ±0.3 to ±0.5 °C.
  • You subtract that MPE from both sides of the label range. That is called a guard band. What remains is your acceptance limit for the mapping study.
  • For your alarm limits, you use the same guard band plus an extra margin for the response time of your technical team.
  • State this reasoning explicitly in the protocol. It is the first thing an auditor will check.

Why "2 to 8 °C" is not your acceptance limit

Many protocols set "2 to 8 °C" as the acceptance criterion. Further down the same page sits a table of loggers with an accuracy of ±0.5 °C. At first glance this looks fine, but the two contradict each other. A concrete example.

Suppose your highest recorded data point is 7.9 °C. Your logger has an MPE of ±0.5 °C. The true temperature therefore lies somewhere between 7.4 and 8.4 °C. In other words, you do not actually know whether the space stayed within 2 to 8 °C. The measurement leaves it open. That kind of conclusion will not survive an audit.

The fix is not necessarily buying a more expensive logger. The fix is that you decide up front how you deal with that MPE, and make the acceptance limit tighter than the label range. That is what the rest of this page is about.

Three concepts that often get mixed up

Before we start calculating, it is worth keeping three quantities apart. Their names sound related, but they serve completely different purposes.

WhatWho sets itWhat it is for
Label range (e.g. 2 to 8 °C)Manufacturer, pharmacopoeiaThe boundary beyond which the product loses quality.
Acceptance limit (mapping)You, in the mapping protocolWhere the mapping data points must fall for the study to be declared valid. Stricter than the label range because of the guard band.
Alarm limit (monitoring)You, after the mappingWhere a fixed monitoring sensor triggers an alarm. Stricter than the mapping limit because of an extra response-time margin.

The rest of this page is about the second row: how do you get from the label range to the acceptance limit? At the end we link that through to the third row.

What exactly is MPE?

MPE stands for Maximum Permissible Error: the largest deviation the manufacturer guarantees your logger will show across the full calibration interval (usually 12 months). It is an umbrella value: everything that can go wrong with the measurement is baked into it. Calibration uncertainty, drift, resolution, linearity: you get one number and the manufacturer guarantees the logger stays within that margin, provided you recalibrate on time.

The MPE lives on your logger's datasheet, sometimes under "accuracy" or "measurement accuracy". For most data loggers it sits somewhere between ±0.1 °C (reference-grade instruments) and ±0.5 °C (standard loggers for GDP work).

One important condition for treating MPE as an umbrella: the logger must have a calibration certificate that is traceable to a recognised reference (think NIST or a comparable national metrology institute), and the calibration must still be valid (typically ≤ 12 months). Only then are you entitled to use the MPE as your guard band. If the calibration is older, or if traceability is missing, the manufacturer's guarantee no longer holds and you will need to build up the contributions individually (see When you need a more detailed calculation).

What is a guard band, in plain terms?

A guard band is nothing more than a safety margin you shave off your limit, on both sides. Think of the speed limit: if you set your cruise control to exactly 130, but your speedometer can be 5 km/h out, you drive 125 to be safe. Those 5 km/h are your guard band.

For a mapping study it looks like this:

Acceptance limit (high)  =  upper label limit  −  MPE
Acceptance limit (low)   =  lower label limit  +  MPE

That is all there is to it. The MPE on your datasheet is your guard band. One subtraction, done.

Worked examples: calculating the acceptance limit

Two typical situations side by side, both with a logger of MPE ±0.5 °C. That is the most common value in day-to-day GDP practice.

Example 1: cold room 2–8 °C

Label range 2 to 8 °C, logger with MPE ±0.5 °C.

Acceptance limit (high)  =  8.0  −  0.5  =  7.5 °C
Acceptance limit (low)   =  2.0  +  0.5  =  2.5 °C

So your acceptance limit is 2.50 to 7.50 °C.

Result: every mapping data point must stay between 2.5 and 7.5 °C in order to claim the space remained within 2 to 8 °C.

Example 2: GDP warehouse 15–25 °C

Label range 15 to 25 °C, same logger with MPE ±0.5 °C.

Acceptance limit (high)  =  25.0  −  0.5  =  24.5 °C
Acceptance limit (low)   =  15.0  +  0.5  =  15.5 °C

So your acceptance limit is 15.50 to 24.50 °C.

Result: every mapping data point must stay between 15.5 and 24.5 °C. This is the standard treatment you see across most GDP warehouse reports.

Ready-made text for your protocol

All mapping data points shall remain within 2.50–7.50 °C. These limits are derived from the label range 2–8 °C, reduced by the MPE of the data loggers used (±0.50 °C) as a guard band. The MPE applies across the full 12-month calibration interval and covers calibration uncertainty, drift and resolution together. All loggers are traceably calibrated within 360 days prior to use. Short-term excursions from deliberate disturbances (door openings, defrost cycles) are evaluated separately in accordance with §X.Y of this protocol.

Unsure about your acceptance limits?

From mapping to alarm limits for your monitoring

After the mapping, you install fixed monitoring sensors at the warmest and coldest positions you found. For those sensors, you configure alarm limits. These serve a different purpose from the mapping acceptance limit: they must warn you before the product is at risk. So an extra layer comes into play: the time your team needs to respond.

In practice you work with a tiered system. Example for a 2 to 8 °C cold room, MPE ±0.5 °C and an operational response margin of 0.5 °C:

LevelLow limitHigh limitWhat happens
Warning3.0 °C7.0 °CInternal notification, technical team keeps an eye on it. No product impact yet.
Action limit2.5 °C7.5 °CTechnicians on site, root-cause investigation started.
Excursion2.0 °C8.0 °CFormal deviation, product assessment by QA.

Extra detail: if your fixed sensor is not located at the warmest point from the mapping, you also need to add the temperature offset between that worst-case position and the sensor location. In our example, an offset of 0.5 °C would push the upper action limit down to 7.0 °C.

When you need a more detailed calculation

The MPE approach is elegant and adequate for most routine mappings. Three situations call for splitting out the individual contributions:

  • You mix logger models with different MPEs in the same study. The umbrella is no longer a single number.
  • Your calibration is older than 12 months, or the logger has no calibration certificate traceable to a recognised reference. The manufacturer's guarantee no longer applies.
  • You want to make the acceptance limit slightly wider than the MPE approach allows, and can show with real numbers that the individual contributions together are smaller than the umbrella MPE.

In those cases you build the combined uncertainty uc from separate contributions and combine them using the root-sum-of-squares method from the GUM (Guide to the Expression of Uncertainty in Measurement). The four main contributions:

  • Calibration uncertainty. Taken from the calibration certificate, typically ±0.1 to ±0.3 °C.
  • Drift. The slow shift in your logger since the last calibration, roughly 0.05 to 0.1 °C per year.
  • Resolution. The smallest step the logger displays, typically 0.1 °C.
  • Spatial gradient. The spread between loggers at any given moment. Usually the largest contribution.

A worked example for a 2 to 8 °C cold room then looks like this:

Detailed calculation for a 2–8 °C cold room

Each source is first converted into a standard uncertainty u, then combined.

SourceValueu (°C)
Calibration uncertainty (from certificate)±0.200.100
Drift over 12 months±0.100.058
Logger resolution0.100.029
Spatial gradient in the room±0.300.173
u_c = √(0.100² + 0.058² + 0.029² + 0.173²)
    = 0.21 °C

Guard band at k = 2:
GB  = 2 × 0.21  =  0.42 °C

Acceptance limit = 2.42 – 7.58 °C

Result: the detailed calculation gives 2.42–7.58 °C instead of 2.50–7.50 °C. A little more working room, at the cost of an extra page of justification. For most protocols, that 0.08 °C is not worth the added complexity over the plain MPE approach.

In short: always start with the MPE approach. Only bring in the detailed calculation if you truly need it.

What to record in the protocol

Auditors look for the same four elements every time. Make sure all four are there.

  1. Which method you apply (MPE subtraction is standard and defensible).
  2. Which MPE value you used and where it comes from (reference to datasheet and calibration certificate).
  3. The validity of your calibrations (date, laboratory, traceability to a national standard).
  4. How you treat borderline cases: data points within 0.1 to 0.2 °C of the limit warrant a separate note, even if formally compliant.

Miss any one of these and the mapping conclusion itself will not stand up in an audit, however carefully you actually measured.

Common mistakes

  • Copying the label range one-to-one as the acceptance limit, with no guard band.
  • Using an MPE without checking that the calibration is still valid.
  • Mixing loggers with different MPEs and forgetting to apply the largest.
  • Setting alarm limits equal to the mapping acceptance limit (losing the response-time margin).
  • Splitting the guard band asymmetrically without justification from the product file.
  • Not stating the method explicitly in the protocol; auditors spot this immediately.

Sources used

  • ISPE Good Practice Guide, Controlled Temperature Chamber Mapping and Monitoring: reference for how to derive acceptance limits and alarm limits.
  • ISO/IEC 17025:2017: requirements for statements of conformity (§7.1.3).
  • JCGM 100:2008, Guide to the Expression of Uncertainty in Measurement (GUM), for the detailed calculation.
  • WHO TRS 961 Annex 9 Supplement 8, Temperature mapping of storage areas.
  • EU GDP 2013/C 343/01, §3.2, on temperature mapping and monitoring positions.
  • ILAC-G8:09/2019, Guidelines on Decision Rules and Statements of Conformity.
  • ANSI/NCSL Z540.3, Test Uncertainty Ratio (TUR).

Go deeper

This page belongs to the protocol and reporting series:

Want to check whether your protocol is audit-ready?

Run your acceptance criteria, calibration status and report content through a short checklist, and see exactly what an auditor will flag first.

Start the audit checkAudit check tool for temperature mapping

Acceptance limits by type of space

Indicative values with a typical MPE ±0.5 °C logger. With a finer logger the guard band shrinks accordingly.

01

Cold room 2–8 °C

The tightest band. Acceptance limit: 2.5–7.5 °C with an MPE ±0.5 °C logger. Consider a ±0.3 °C logger for extra working room.

02

Warehouse 15–25 °C

Wide band, no worries. Acceptance limit: 15.5–24.5 °C. Do account explicitly for seasonal influences: measure in the warmest month.

03

Freezer −20 °C

Band typically −25 to −15 °C. Acceptance limit: −24.5 to −15.5 °C. Important: handle defrost cycles separately in the dataset.

04

Climate chamber (T + RH)

Separate MPEs for temperature and relative humidity. The RH MPE is usually 2 to 3 %. Subtract that from your RH label range.

05

Pharmacy fridge

Small volume, favourable case. Acceptance limit: 2.5–7.5 °C. Product liability still calls for an explicit calculation.

06

ULT freezer −80 °C

Wide band, so the MPE has a relatively small effect. Focus shifts to recovery after door openings and product position within the drawers.

Want to work this through for your own space? Request a short advice call. One session is usually enough to make your protocol text watertight.

Frequently asked questions

Practical answers to the most-asked questions on acceptance criteria and measurement uncertainty in temperature mapping.

Tip: a specific situation? The sources list above covers every guideline you need to justify your choice.

Basics

What is the difference between an acceptance limit and an alarm limit?
The acceptance limit applies to the temporary mapping study: every data point must fall within it for the study to be declared valid. The alarm limit applies to permanent monitoring and warns your team before the product limit is reached. Both derive from the same label range, but with different margins: mapping only accounts for the MPE, while monitoring adds an operational response margin on top.
Where do I find the MPE of my logger?
On the manufacturer's datasheet, usually under "accuracy" or "measurement accuracy". The MPE applies across the full calibration interval (typically 12 months) and covers all contributions together: calibration uncertainty, drift, resolution and linearity. Condition: the logger must still be within its valid calibration period.
What if my calibration is older than 12 months?
The manufacturer's MPE guarantee no longer applies. You will then need a more detailed calculation, breaking out calibration, drift and spatial gradient separately following the GUM method. In practice, it is almost always easier to recalibrate than to build that extra calculation.

Guard band and logger choice

What is TUR and why at least 4:1?
TUR stands for Test Uncertainty Ratio: the ratio between the tolerance and twice the MPE. In plain terms, is your logger fine enough for the band you want to claim? The rule of thumb TUR ≥ 4:1 comes from ANSI/NCSL Z540.3 and ILAC-G8. Below that value, the logger is too coarse for the application and no guard band will save you.
Can you apply the guard band asymmetrically?
Only with justification. If the risks at the warm and cold side clearly differ (for example, a 2 to 8 °C vaccine that tolerates freezing but not heat), you may split the guard band asymmetrically. Document the reasoning in the protocol with a reference to the product file or SmPC.

Practice and borderline cases

What do you do with data points just inside the acceptance limit?
Points inside the limit are compliant by definition. What stands out is the edge: values within 0.1 to 0.2 °C of the limit warrant a separate note in the report and usually an additional risk assessment. They are not automatically grounds for rejection, but they signal that the margin is thin.
What if I use loggers with different MPEs in the same study?
Take the largest MPE in your set as the guard band for the whole study. That is the conservative choice and defensible in an audit. If you want to be stricter, apply the MPE of each logger to its own measurement point, but that complicates reporting and interpretation. In practice, most protocols choose the simpler route.