GDP requirements for temperature mapping, explained in practical terms

If you want to know what GDP really expects from temperature mapping, the answer is not just “run a study”. GDP is about documented control: initial mapping before use, measurement under representative conditions, monitoring positions derived from the mapping results and reassessment when the situation changes. This page translates those expectations into day-to-day practice for GDP warehouses, 15-25 °C storage areas, 2-8 °C cold rooms and other controlled storage environments.

What reviewers focus on

  • Initial mapping before first use
  • Measurement under representative conditions
  • Monitoring position justified by mapping results
  • Remapping after change, trend or new risk
In short

GDP does not give a fixed formula for the number of loggers or the study duration, but it does require a defensible approach. Chapter 3.2.1 of the EU GDP guideline states that storage areas should be mapped before use under representative conditions and that temperature-monitoring equipment should be positioned according to the mapping results. In practice that means a sound protocol, logical measurement points, clear acceptance criteria, a clear report and a direct translation into routine monitoring.

From GDP requirement to practical study design

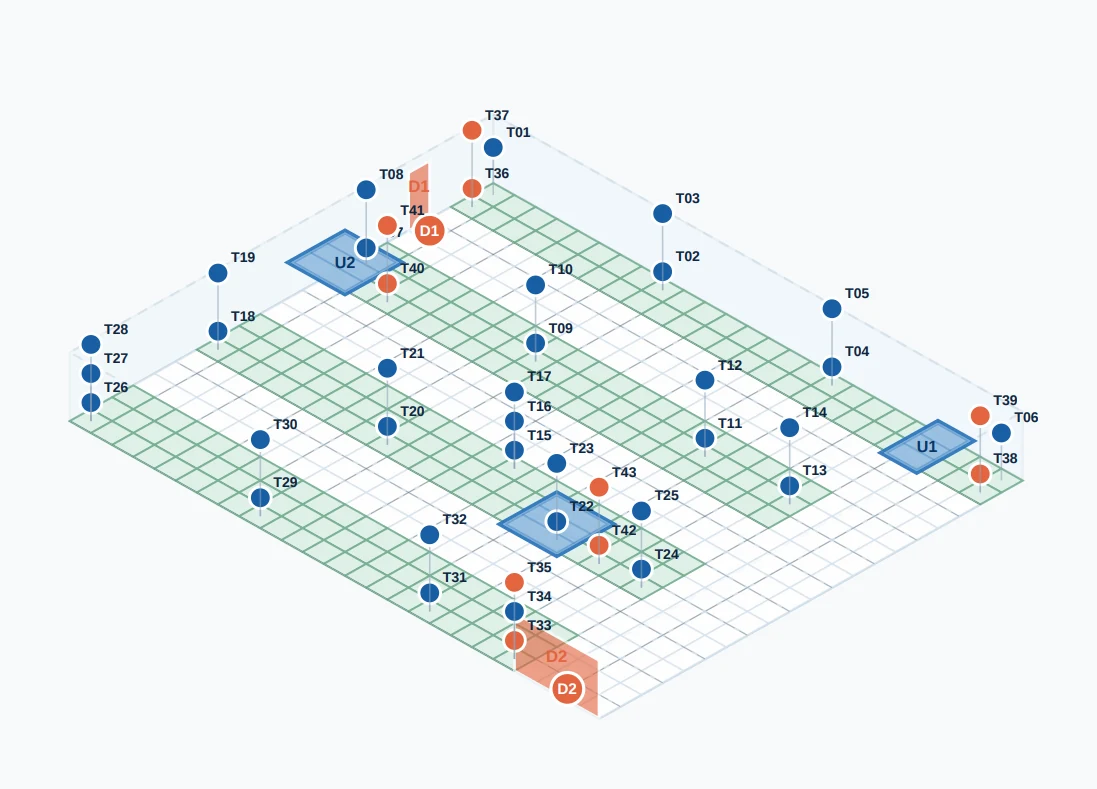
Use our logger placement tool and combine it with an audit-ready protocol and report. That makes the step from guideline to execution much more concrete.

Open logger placement tool Have a protocol and report prepared 3D mapping tool for temperature mapping

What does GDP actually require?

The core expectation sits in chapter 3.2.1 of the EU GDP guideline. In practice, four requirements follow from it: map before first use, measure under representative conditions, derive routine monitoring positions from the mapping outcome and reassess when the storage situation changes.

It is also important to recognise what GDP does not do. It does not prescribe one universal number of data loggers, one fixed duration for every room or one grid formula that always applies. Those practical choices must be justified on a risk basis. That is exactly where WHO, ISPE and authority interpretations become useful.

GDP requirementWhat that means in practice
Initial mapping before useBefore a warehouse, cold room or other storage area is used for GDP-regulated products, you should demonstrate how temperature behaves across the space.
Representative conditionsThe study should reflect normal use. Think realistic loading, door openings, airflow, weekday pattern and, where relevant, seasonal influence.
Monitoring position from mappingThe mapping should show where fixed monitoring logically belongs. A report that contains graphs but does not justify the monitoring point remains incomplete.
Reassessment after changeAfter changes to the room, cooling system, HVAC, layout, product profile or usage pattern, you should assess whether remapping or requalification is required.

GDP is about demonstrable control, not just a finished graph set

This is where many organisations struggle. A study has been performed, but there is not enough rationale for why those measurement points were selected or where the permanent monitoring sensor should go afterwards. The link to procedures, deviation handling and Quality Agreements with logistics partners is often weak as well.

That is why temperature mapping under GDP is always a combination of technical execution and quality-system control. The measurement itself matters, but the protocol, the report, the monitoring decision and the contractual framework matter just as much in an audit.

Want to check whether your storage meets GDP?

When is temperature mapping needed under GDP?

Not just at the start. There are several situations in which a new study or a reassessment of the existing rationale becomes sensible or necessary.

01

New area before first use

A new warehouse, a new cold room, a new storage zone or a new site needs an initial mapping before GDP-regulated products are stored there in routine operation.

02

Change to HVAC or cooling

A new cooling unit, adjusted airflow, changed setpoints, major maintenance or a revised standby configuration can change the temperature profile significantly.

03

Change in layout or loading

New racking, higher stack heights, denser pallet walls, changed traffic routes or a very different loading pattern can affect airflow and temperature gradients.

04

Recurring trends or deviations

Repeated alarms, temperature excursions, persistent warm or cold corners or doubt about the current monitoring position are clear triggers to review the mapping basis.

05

Seasonal influence not yet justified

For spaces with external walls, loading bays, solar load or strong outside-temperature effects, additional summer or winter mapping may be warranted.

06

Outsourced storage or transport changes

If you change logistics partners or revise storage or transport arrangements, you still need clear evidence that temperature requirements and monitoring responsibilities remain controlled.

How should you interpret GDP in practice?

The guideline itself is deliberately high level. The real quality lies in how you translate it into a protocol, logger strategy, report and monitoring setup that actually fit the storage area.

Tip: do not try to prove only that the room is “probably fine”. Show where the risk zones are, why the logger locations make sense and how routine monitoring follows from those findings.

Representative conditions means normal operation, not an ideal quiet day

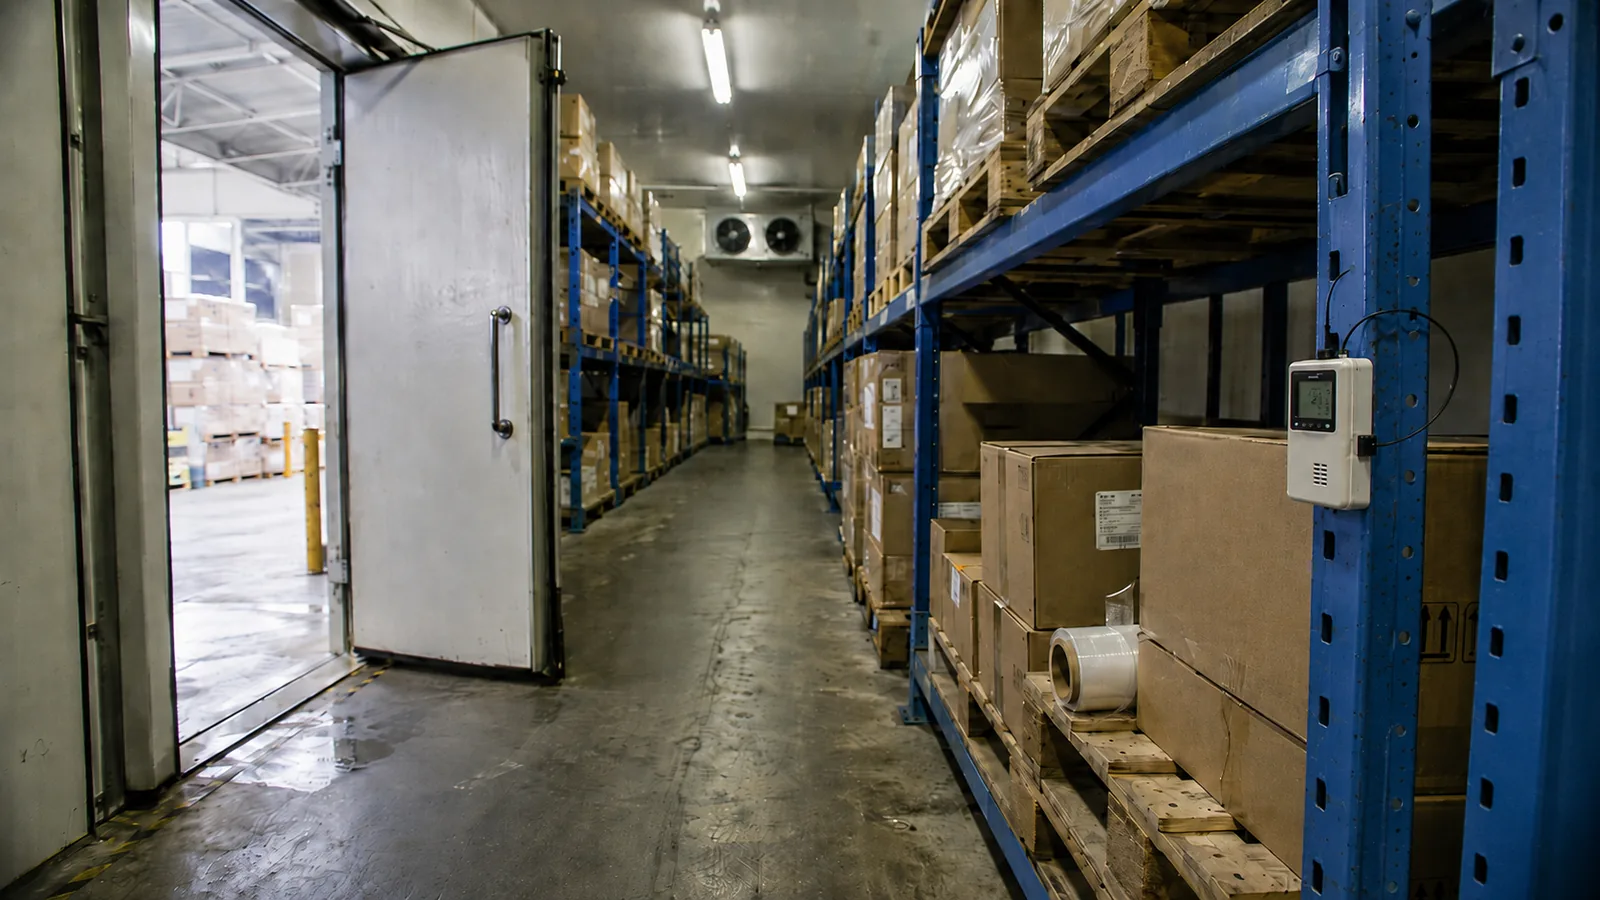
GDP uses the phrase representative conditions for a reason. In a warehouse that means more than hanging a few loggers in an empty aisle. It may include racking, realistic product loading, workweek activity, door movement, vertical temperature differences and locations where air behaves differently from what a floor plan suggests.

The same principle applies to cold rooms and smaller controlled storage. There too, the study should reflect real use: shelf arrangement, load pattern, door openings, evaporator influence and recovery behaviour after disturbance.

International readers should treat the Dutch IGJ FAQ as an authority example, not as the rule itself

The Dutch Health and Youth Care Inspectorate, or IGJ, is the competent authority in the Netherlands. Its GDP FAQ is useful because it shows how one inspectorate translates EU GDP into practical inspection expectations. That is especially helpful around warehouse study duration, representative variables and the role of mapping in selecting permanent monitoring positions.

For an international audience, however, EU GDP remains the primary standard. The IGJ material is best used as an example of how a regulator may interpret and assess the same European GDP principles in practice.

For a GDP warehouse or cold room, the real search question is often more practical than the guideline title

Most teams do not search for a chapter number. They search for questions such as: how many loggers are needed in a GDP warehouse, how long should a GDP mapping run, where should the monitoring sensor be located in a 15-25 °C area and when does a 2-8 °C cold room need remapping? A useful knowledge page should answer those practical questions directly.

If you are working on a specific space, also see our pages on temperature mapping for a GDP warehouse 15-25 °C and temperature mapping for a cold room 2-8 °C. That connects the guidance to the room you actually need to qualify or justify.

Routine monitoring positions should follow from mapping results

This is one of the most important GDP points. The mapping is not only there to show whether a storage area passes once. It is also there to justify where routine monitoring should be located. That is not automatically the centre of the room and not always next to the door. The right location follows from warm and cold zones, product positions, airflow and recovery behaviour.

That is why a mapping report should explicitly recommend the routine monitoring location and explain the rationale. Without that step, the link between study and daily control remains weak.

An inspection-ready protocol and report are part of GDP control, not just documentation overhead

The protocol should define scope, measurement points, heights, logger IDs, duration, sampling interval, loading condition, acceptance criteria and deviation handling before the study begins. The report should then show what the data mean, where the risk zones are and which monitoring position is justified.

To build that out properly, it helps to read what belongs in a temperature mapping protocol, the difference between protocol and report and what belongs in a mapping dossier.

Study duration should be risk-based, but know the practical inspection benchmark as well

GDP does not prescribe one universal duration, but practical benchmarks do exist. For warehouse mapping, the Dutch IGJ FAQ is often cited because it explicitly states that seven consecutive days including a weekend is a realistic duration for an initial warehouse mapping. That helps capture normal daily variables such as outside temperature, day-night pattern, movement of people and equipment, door openings and changes in cooling or ventilation behaviour.

Where those variables can be shown to be limited, the same Dutch interpretation refers to 48 hours as a possible minimum in justified cases. For cold rooms, freezer rooms and more compact storage, the suitable duration often differs. The important point is that duration should be linked to room type, use, relevant variables and audit purpose rather than copied blindly from an old protocol.

Quality Agreements are a fixed part of GDP control

Where storage or transport is outsourced, the technical setup is only half the story. You also need written agreement on applicable temperature conditions, what counts as an excursion, who is notified within what timeframe, who assesses the deviation and who is responsible for calibration and maintenance of loggers and monitoring systems.

This is one of the recurring themes in inspection findings. A contract that says deviations will be reported, but does not define limits or escalation, gives very little protection in an audit.

What inspection findings keep showing up in practice

In our article on recent observations from GDP/GMP inspections, we analysed 58 public Dutch inspection reports. Even though those reports are Dutch, the lessons travel well because the findings are framed against the same EU GDP and EU GMP principles used across Europe. The pattern is clear: temperature findings rarely concern only a broken cold room. Much more often they concern rationale, documented control and contractual clarity.

  • The mapping does not show where and how many sensors are needed. A study was completed, but the report does not support routine monitoring design.
  • Loggers are placed in convenient positions rather than meaningful product locations. Corner-only placement or a neat but generic grid often tells too little about real risk zones.
  • Preventive monitoring is missing or not linked to the mapping. Reporting excursions afterwards is not the same as demonstrating control.
  • Quality Agreements remain too generic. Temperature limits, reporting timelines and excursion responsibilities are not defined sharply enough.
  • Calibration and maintenance are not clearly controlled. That too falls under the auditable state of control of the system.
  • Storage conditions are not described consistently. If procedures, labels, instructions and contracts all say slightly different things, control quickly becomes hard to demonstrate.

How do you stay out of that pattern?

Work from a clear chain of logic. Start with the room and its operating risks, translate that into logger placement and study duration, define the decisions in advance, make an explicit recommendation on routine monitoring position and then anchor the temperature limits and escalation rules in procedures and Quality Agreements.

That may sound formal, but it actually makes the process more practical. A good dossier creates operational clarity, makes deviations easier to assess and avoids re-explaining during an audit why a sensor is positioned where it is.

Practical GDP checklist for your next mapping study

If you can tick these points off, the foundation is usually in good shape.

  • The storage area is clearly defined and described.
  • The reason for the mapping is documented: initial qualification, change, trend or reassessment.
  • Loading condition, door use and other study conditions are representative of normal operation.
  • Logger locations are selected on the basis of product positions, airflow and risk areas.
  • Logger IDs and calibration certificates are fully traceable.
  • Acceptance criteria are stated in the protocol before the study begins.
  • The report identifies hot and cold zones and recommends a monitoring position.
  • Deviation handling, trends and remapping triggers are described procedurally.
  • Quality Agreements define excursion criteria, reporting timelines and responsibilities.
  • The outcome has been translated into day-to-day monitoring practice.

Frequently asked questions about GDP and temperature mapping

Short, practical answers for QA teams, wholesalers, logistics providers and other organisations working with controlled storage.

Is temperature mapping required under GDP?
For GDP-regulated medicinal-product storage, temperature mapping is a core part of demonstrable temperature control. Chapter 3.2.1 of the EU GDP guideline states that an initial temperature mapping exercise should be carried out on the storage area before use, under representative conditions.
What does GDP mean by representative conditions?
The study should reflect normal use. That includes realistic loading, door movements, airflow, workweek pattern and, where relevant, seasonal influence. An unrealistically favourable test setup is often not representative enough.
Does GDP set a fixed number of data loggers or a fixed study duration?
No. GDP sets the requirement, but not a universal formula for every room. The number of measurement points and the study duration should be risk-based. WHO and ISPE are useful for the practical test strategy. For an initial measurement-point layout for your room or unit, you can use the 3D logger placement tool as a starting point for your protocol.
How long should a GDP warehouse mapping last?
EU GDP itself does not prescribe one fixed duration for every warehouse. In Dutch practice, the IGJ FAQ is often cited as an example of a national authority interpretation: seven consecutive days including a weekend is considered realistic for an initial warehouse mapping, with 48 hours as a minimum in justified situations where relevant variables are demonstrably limited.
Should routine monitoring positions really follow from the mapping?
Yes. That is one of the key practical GDP points. The mapping should not only show whether the area remains within specification, but also justify where routine monitoring should be located. To check whether your current monitoring sensor sits at a representative worst-case position, use the monitoring position check.
When is remapping or requalification needed?
After significant changes to the room, HVAC, cooling system, layout, product profile, monitoring system or after recurring trends and deviations. The decision should be risk-based and documented.
Should a Quality Agreement include temperature responsibilities?
Yes, especially when storage or transport is outsourced. Define temperature limits, excursion criteria, reporting timelines, escalation and responsibilities for calibration and maintenance of loggers and monitoring systems in writing.
How should international readers use the Dutch IGJ FAQ?
Treat it as a Dutch inspectorate’s practical interpretation of EU GDP, not as the European rule itself. For international use, EU GDP remains the primary standard, while the IGJ FAQ is helpful as an example of how one competent authority translates GDP into inspection expectations.
How can Temperature Mapping Europe help with this?
Temperature Mapping Europe supports logger placement, full mapping studies, audit-ready protocols and reports, and self-performed mapping with rental loggers. That allows you to translate GDP requirements into a practical and defensible study. If you're weighing self-measurement with rental loggers against a full-service study, the service level selector helps you compare the options.