Temperature mapping for laboratories

Preparing for an ISO/IEC 17025 accreditation assessment, an ISO 15189 medical-lab audit, an ISO/IEC 17043 PT provider review or a GMP QC-lab inspection? A temperature mapping study by Temperature Mapping Europe provides the evidence your assessor and quality manager expect, for lab fridges, freezers down to -80 °C, cryogenic vessels, incubators, drying ovens, water baths, thermal blocks and climate chambers.

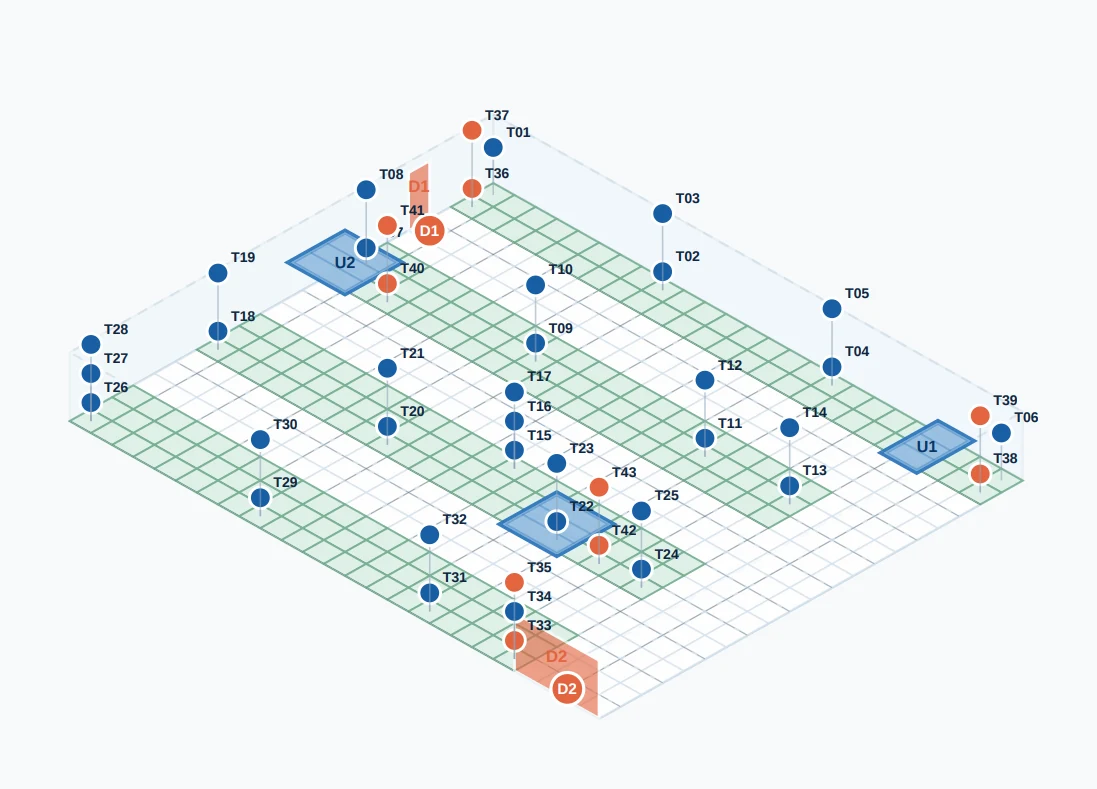
3D measurement-point layout from the temperature mapping tool, showing sensor positions across shelves and the door zone of a laboratory refrigerator.
In brief

Laboratory temperature mapping is a documented study that measures whether every sample or reference location inside a lab fridge, freezer, incubator, drying oven, water bath or climate chamber stays within its specified temperature range under real loading. The study identifies hot and cold spots, justifies where the fixed monitoring probe should sit, and provides the evidence an ISO/IEC 17025 or ISO 15189 assessor, an ISO/IEC 17043 PT reviewer or a GMP QC-lab inspector expects to see.

Three questions an accreditation assessor may ask about your lab equipment

ISO/IEC 17025:2017, ISO 15189:2022 and ISO/IEC 17043:2023 share a common principle: facilities and environmental conditions that can affect laboratory or PT activities must be suitable and appropriately monitored and controlled. The exact requirements and clause structure differ between the standards. In practice, these requirements lead to several useful questions when reviewing temperature-controlled laboratory equipment.

"Clause 6.3.1 says facilities and environmental conditions shall not adversely affect the validity of results. How do you show that for this fridge?"

The clause is short, but the burden of proof is not. Without a mapping study, the answer usually falls back on the manufacturer's specification sheet and the internal display reading, which say nothing about the actual sample position. Mapping replaces that with data: the measured distribution across shelves and drawers, the door-open effect during peak use, and a documented conclusion that the storage or analysis condition is met at every use location, with predefined acceptance criteria and, where a statement of conformity is made, a documented decision rule that addresses measurement uncertainty and decision risk.
"The display reads 37.0 °C. How do you know your samples on the top shelf are actually at 37 °C ± 1 °C?"

Incubators, drying ovens and water baths are the classic accreditation trap. Gradients of 1 to 2 K between shelves, between the door zone and the back wall, or between an empty chamber and a loaded chamber are common, and can silently invalidate a microbiological method, a loss-on-drying determination, or a PT item. Mapping quantifies the actual distribution and identifies which positions are safe to use for which methods.

"Where is your monitoring sensor inside the freezer, and does the mapping data justify that position?"

The equipment's factory control sensor is not necessarily located at the position most representative of the stored samples or materials. Mapping can be used to justify the location of a routine monitoring sensor in relation to critical storage or use locations and the temperature distribution identified during the study, and can support the selection of monitoring locations and alarm limits that are relevant to those critical locations.

Test your own file against the questions an assessor raises

The three questions above are just the start. Our free audit-readiness check runs your temperature-mapping and monitoring documentation past the review points that ISO/IEC 17025, ISO 15189 and ISO/IEC 17043 assessors, and GMP inspectors, actually examine, tailored to your equipment: lab fridge, freezer, ULT, incubator, drying oven, water bath or climate chamber. In five to ten minutes you receive a PDF report showing where your file is strong, and where an assessor might raise a finding.

Grounded in ISO/IEC 17025:2017, ISO 15189:2022, ISO/IEC 17043:2023, EU GMP Annex 15, WHO and ISPE guidance, plus 37 concrete findings from 58 Dutch GDP/GMP inspection reports.

Audit-readiness check for laboratory temperature mapping: PDF report showing document strengths and gaps against assessor control points

Three levels: from renting loggers to full on-site execution

The mapping study is the same. What differs is how much of the work your lab team performs, and how much we take over. Pick the level that fits your internal calibration and validation capacity, and how much time remains before the surveillance visit, the scope extension or the customer audit.

LevelYour teamTemperature Mapping EuropeWhat we deliver
  1. Level 1€299
    Calibrated data loggersYour team runs the study, writes the protocol and the report
  2. Level 2€599
    + Protocol upfront and analysis report afterYour team places the loggers inside the fridge, incubator or chamber
  3. Level 3€999
    + Complete on-site executionYou provide site access, method context and equipment specifications

Loggers ship as a plug-and-measure case with calibration certificates traceable to national standards. See what is in the case.

View all pricing and service levels

Delivered by professionals with experience in ISO/IEC 17025 and GMP quality systems

At Temperature Mapping Europe, your mapping study is handled by people who have worked on both sides: the accreditation and pharmaceutical quality frameworks that assessors reference, and the practical reality of running a fridge, an incubator or a climate chamber inside a working lab.

ISO/IEC 17025 and GMP experience

We combine hands-on experience in quality management within EU-GMP/GDP environments with practical familiarity of ISO/IEC 17025 testing and calibration labs and ISO 15189 medical labs. That means the dossier speaks the language a lead assessor, an internal quality officer and a GMP inspector all expect, and covers the crossover cases where a lab operates under two standards at once.

Traceable calibration

Every logger is supplied with a calibration certificate from the calibration laboratory used, traceable to national standards through the ILAC-MRA chain. That traceability is what makes the mapping data admissible under clause 6.4 (equipment) and clause 6.5 (metrological traceability) of ISO/IEC 17025.

Vendor-neutral

Temperature Mapping Europe is an independent company, not a manufacturer, distributor or label of any equipment supplier. We sell no monitoring systems of our own and choose data loggers on a brand-neutral basis. Our approach follows ISO, ISPE, WHO, GDP and GMP guidance, independent of any supplier.

Personal approach

The same person defines the measurement setup, assesses the equipment, processes the data and writes the report. That gives you short lines, fast planning and one fixed point of contact from intake to signed dossier.

Temperature Mapping Europe office setting.

Aligned with ISO/IEC 17025. Delivered by industry professionals.

What gets measured, and how much of it

The number of loggers, the study duration and the risk zones depend on the equipment type, the temperature setpoint, the loading and the method that will be run at that location. Below is our typical risk-based scope for lab-side equipment; the exact plan is set in the mapping protocol, drawing where applicable on the WHO temperature-mapping guidance, the ISPE Good Practice Guide: Controlled Temperature Chambers, Commissioning and Qualification, Mapping and Monitoring (Second Edition), DIN 12880 for heating ovens and incubators, and DKD-R 5-7 for climatic chambers.

2-8 °C · -20 °C · -80 °C · LN2

Storage equipment: fridges, freezers, ULTs, cryogenic vessels

For reagents, standards, calibrators, controls, patient samples, blood products, cell banks, biobank materials and PT items awaiting dispatch. Our typical risk-based scope for a lab fridge or -20 °C freezer uses 9 to 15 measurement points across shelves and drawers, the door zone, the back wall and near the evaporator plate, over at least 72 hours, including a representative working day. ULT -80 °C freezers and cryogenic vessels get extra points at rack, box and door level, with attention to defrost cycles and vapour-phase gradients.

  • Warmest and coldest shelf under real loading
  • Door-open excursions during peak lab hours
  • Freezing risk for 2-8 °C biologics near the evaporator
  • Vapour-phase gradients in LN2 storage and temperature gradients in ULT storage
  • Justified monitoring probe position and alarm limits
30 °C · 37 °C · ovens up to 250 °C · climate chambers

Analysis and process equipment: incubators, ovens, water baths, chambers

For microbiological incubation, cell culture, sterility testing, loss-on-drying, gravimetric determinations, sample conditioning, viscosity baths, thermal-block assays and climate-chamber method testing. Our typical risk-based scope for an incubator or drying oven uses a measurement layout appropriate to the equipment and intended use; where DIN 12880:2007-05 is specifically applied, its prescribed measurement arrangement is followed. For climate chambers, empty and representative loaded mapping studies may form part of OQ and/or PQ, depending on the intended use and qualification strategy.

  • Uniformity and stability at the setpoint
  • Recovery after opening under real loading
  • Shelf and drawer positions safe for each method
  • Justified sample positions for stability studies, loss-on-drying determinations and PT items
  • Relative humidity, where the chamber controls it

How the number of measurement points is decided

Each type of lab equipment has its own risks

Measurement points are selected based on how the equipment is used, what stays inside it, the method requirement and the question the dossier needs to answer for the assessor.

EquipmentWhat does mapping assess?Typical output
Lab fridge 2-8 °CShelves, door zone, back wall, evaporator plate, loading and sensor position.Justified 2-8 °C reagent, standard and sample zones, plus monitoring probe position.
-20 °C freezerDrawers, door influence, recovery after opening, defrost cycles and temperature gradients.Substantiation of sample and kit storage locations, plus monitoring position.
ULT -80 °C freezer or cryogenic vesselRacks, boxes, door zones, recovery after opening and vapour-phase gradients.Insight into worst-case zones for biobank samples, cell banks and reference materials.
Incubator (CO2, microbial, cell culture)Shelf-to-shelf uniformity, door recovery, loading pattern and stability at setpoint.Assessment of shelf positions suitable for the method, plus probe justification.
Drying oven, muffle furnace, water bath, thermal blockSpatial gradients at setpoint, ramp behaviour, recovery and homogeneity across the working volume.Substantiation that gravimetric, sterilisation, PCR or viscosity conditions are met.
Stability or climate chamberTemperature (and RH where applicable) at every shelf position, empty and loaded, at ICH-type conditions.Qualified sample locations for stability studies, loss-on-drying determinations or method development.

What does the dossier contain?

A laboratory mapping dossier should make it clear why the measurement design was logical, how the method or storage requirement drives the acceptance criteria, what the data show under real loading, and how routine monitoring follows from the results. That chain gives an assessor, reviewer or inspector a clear basis for evaluating the study and its conclusions.

"The mapping showed that our top-shelf incubator position sat one full degree above the display value. We moved the plates to the qualified shelves and updated the SOP before the accreditation visit."
Illustrative example, medical laboratory

See what a mapping dossier contains

Mapping protocolScope, method or storage requirement, duration, interval, conditions and acceptance criteria.
Risk assessmentImpact of loading, method sensitivity, sample criticality and deviation history.
Measurement-point planRationale for each logger position, based on equipment geometry, intended use and risk, with applicable external guidance or equipment-specific standards identified in the protocol.
Raw data and trend graphsTemperature trend per logger, excursions, recovery events and relevant observations.
Hot/cold-spot analysisSubstantiation of warmest and coldest positions, monitoring probe location and alarm-limit guard band.
ConclusionSuitability of the equipment for its intended use, including calibration certificates and CAPA input where needed.

See a measurement-point proposal for your own fridge, freezer or incubator

Before requesting a quote, use the free 3D mapping tool to sketch your lab fridge, freezer, incubator or climate chamber. You get a proposed sensor layout, an estimated number of loggers and a first indication of the study scope, so the consultation starts with a concrete picture instead of a blank protocol page.

3D measurement-point layout from the temperature mapping tool, for a laboratory fridge or incubator

When to use mapping?

Temperature mapping should be considered within the equipment lifecycle. The need for repeat mapping should be reviewed following relevant changes, adverse performance trends or other risk-based triggers.

New accreditation scope or extension of scope under ISO/IEC 17025 or ISO 15189New lab fridge, ULT freezer, incubator, drying oven or climate chamberRelocation of equipment, HVAC modification or change to the power supplyPreparation for an RvA, DAkkS, UKAS, COFRAC, Accredia or ENAC assessmentPreparation for an ISO/IEC 17043 PT provider re-assessmentDeviation, complaint or unexplained OOS with a temperature root causeChange in loading pattern, shelf configuration or methodPeriodic risk-based requalification and monitoring probe review

Request advice for your laboratory

Frequently asked questions

What does temperature mapping for a laboratory involve?
Temperature mapping in a laboratory is a documented study that measures whether every sample or reference location inside a lab fridge, freezer, incubator, drying oven, water bath or climate chamber stays within its specified temperature range under real loading. The study identifies hot and cold spots, justifies where the fixed monitoring probe should sit, and provides the evidence an ISO/IEC 17025 or ISO 15189 assessor, an ISO/IEC 17043 PT reviewer or a GMP QC-lab inspector expects to see.
Does ISO/IEC 17025 require temperature mapping?
ISO/IEC 17025:2017 does not prescribe temperature mapping by name. Clause 6.3 requires facilities and environmental conditions to be suitable for laboratory activities and requires relevant environmental conditions to be monitored, controlled and recorded. Clause 6.4 requires equipment to conform to specified requirements before use, while clause 7.4.4 requires specified storage or conditioning conditions for test and calibration items to be maintained, monitored and recorded. Where spatial temperature variation could affect the condition of test items or the validity of laboratory activities, temperature mapping can provide evidence that the required conditions are achieved throughout the relevant working or storage volume.
What does ISO 15189 expect for storage of patient samples and reagents?
ISO 15189:2022 requires facilities and environmental conditions to be suitable for laboratory activities and not to adversely affect the validity of results or safety. Clause 6.3.3 requires storage conditions that maintain the continuing integrity of samples, equipment, reagents and other relevant materials. Clause 6.6.2 further requires reagents and consumables to be stored according to manufacturers' specifications and relevant environmental conditions to be monitored. Temperature mapping is not prescribed by name, but it can provide spatial evidence that temperature-controlled storage conditions are achieved throughout the locations in which critical materials are actually stored.
Does an ISO/IEC 17043 proficiency-testing provider need to map its storage?
Not explicitly. ISO/IEC 17043:2023 does not prescribe temperature mapping by name. It does require environmental conditions that can influence the validity of PT activities or PT items to be appropriately controlled, monitored and recorded. PT items must also be sufficiently stable throughout the relevant period, including storage and transport, and must be stored in a way that prevents deterioration. Where spatial temperature variation could affect the stability or integrity of temperature-sensitive PT items, a mapping study can provide robust evidence that the storage environment is suitable.
Do we need to map an incubator that already has an internal sensor?
Not automatically. An internal control sensor does not by itself demonstrate spatial temperature uniformity throughout all usable sample positions. Where incubation temperature is important to the validity of a method, the laboratory needs appropriate evidence that the relevant working positions meet the required conditions. A spatial temperature mapping study is one method of generating that evidence and can also support the selection of suitable sample locations and routine monitoring positions.
How many measurement points does a lab fridge, freezer or incubator need?
ISO/IEC 17025, ISO 15189 and ISO/IEC 17043 do not prescribe a fixed number of temperature-mapping points. For a typical upright laboratory refrigerator or -20 °C freezer, our risk-based default is usually 9 to 15 loggers distributed across relevant shelves, drawers and other potential risk zones. Where a specific external method or standard is applied, its measurement layout takes precedence. For example, the WHO cold-chain temperature-mapping method uses 12 mandatory sensors, while DIN 12880:2007-05 uses 9 measurement points for working chambers up to 50 litres and 27 points for larger heating ovens and incubators. The final number and locations are documented in the mapping protocol based on equipment geometry, intended use, loading and applicable requirements.
How often should a lab fridge, freezer or incubator be re-mapped?
ISO/IEC 17025 and ISO 15189 do not prescribe a fixed temperature-mapping or re-mapping interval. The need and frequency should be justified based on intended use, risk, change control and performance history. Relevant triggers can include relocation, significant repair or modification, changes to the loading or shelf configuration, unexplained temperature excursions, or other evidence that the previously established temperature distribution may no longer be representative.
What is the difference between calibration and temperature mapping in a lab?
Calibration establishes the relationship between the indication of a measuring instrument or sensor and reference values under specified conditions, with documented metrological traceability and measurement uncertainty as applicable. Temperature mapping is a spatial study: many calibrated loggers distributed across the whole usable volume of the fridge, freezer, incubator or chamber, over a representative period, showing the temperature distribution and identifying worst-case positions. Calibration alone cannot demonstrate that a sample against the back wall stays in specification. Mapping is what makes that claim defensible. See the difference between monitoring and mapping for the corresponding comparison with routine monitoring.
How does laboratory temperature mapping fit into the qualification of GMP QC equipment?
For a QC or release laboratory operating under EU GMP, temperature mapping can form part of the qualification evidence for equipment used to store or condition samples, standards or other temperature-sensitive materials. Under EU GMP Annex 15, OQ verifies that equipment operates as intended throughout its anticipated operating ranges, while PQ verifies effective and reproducible performance under conditions representative of its intended use. Depending on the qualification strategy, empty and loaded mapping studies may support OQ and/or PQ. Some GMP laboratories also hold ISO/IEC 17025 accreditation for specific testing activities, but ISO/IEC 17025 accreditation is a separate framework and is not a general EU GMP requirement. See the pharma and biotech service page for the production-side counterpart.