Why we did this analysis
Temperature mapping and monitoring are central to good pharmaceutical distribution and manufacturing practice. However, the precise expectations often remain abstract until an inspector arrives. At Temperature Mapping Europe, we follow inspection practice closely. We therefore reviewed 58 recent, publicly available IGJ inspection reports and extracted and classified every identified deficiency.
The findings show clearly why rigorous temperature mapping matters. This article first presents the overall picture from GMP and GDP inspections, then focuses on temperature control and mapping. Where useful, we reproduce translated excerpts from the reports to show how deficiencies are formulated in practice.
About the dataset and the method
The analysis covers 58 final IGJ reports on inspections conducted between 26 June 2024 and 23 April 2026: 32 GDP-only inspections of wholesalers and logistics operators, 18 GMP-only inspections of manufacturers and 8 combined GMP/GDP inspections. Pharmacovigilance reports were excluded.
For each report, we used the inspectorate’s own summary count of critical, major and other deficiencies. We then recorded every individual deficiency together with its severity, cited EU GMP or EU GDP reference and report text, before assigning it to the GMP or GDP domain and a substantive theme.
The overall picture
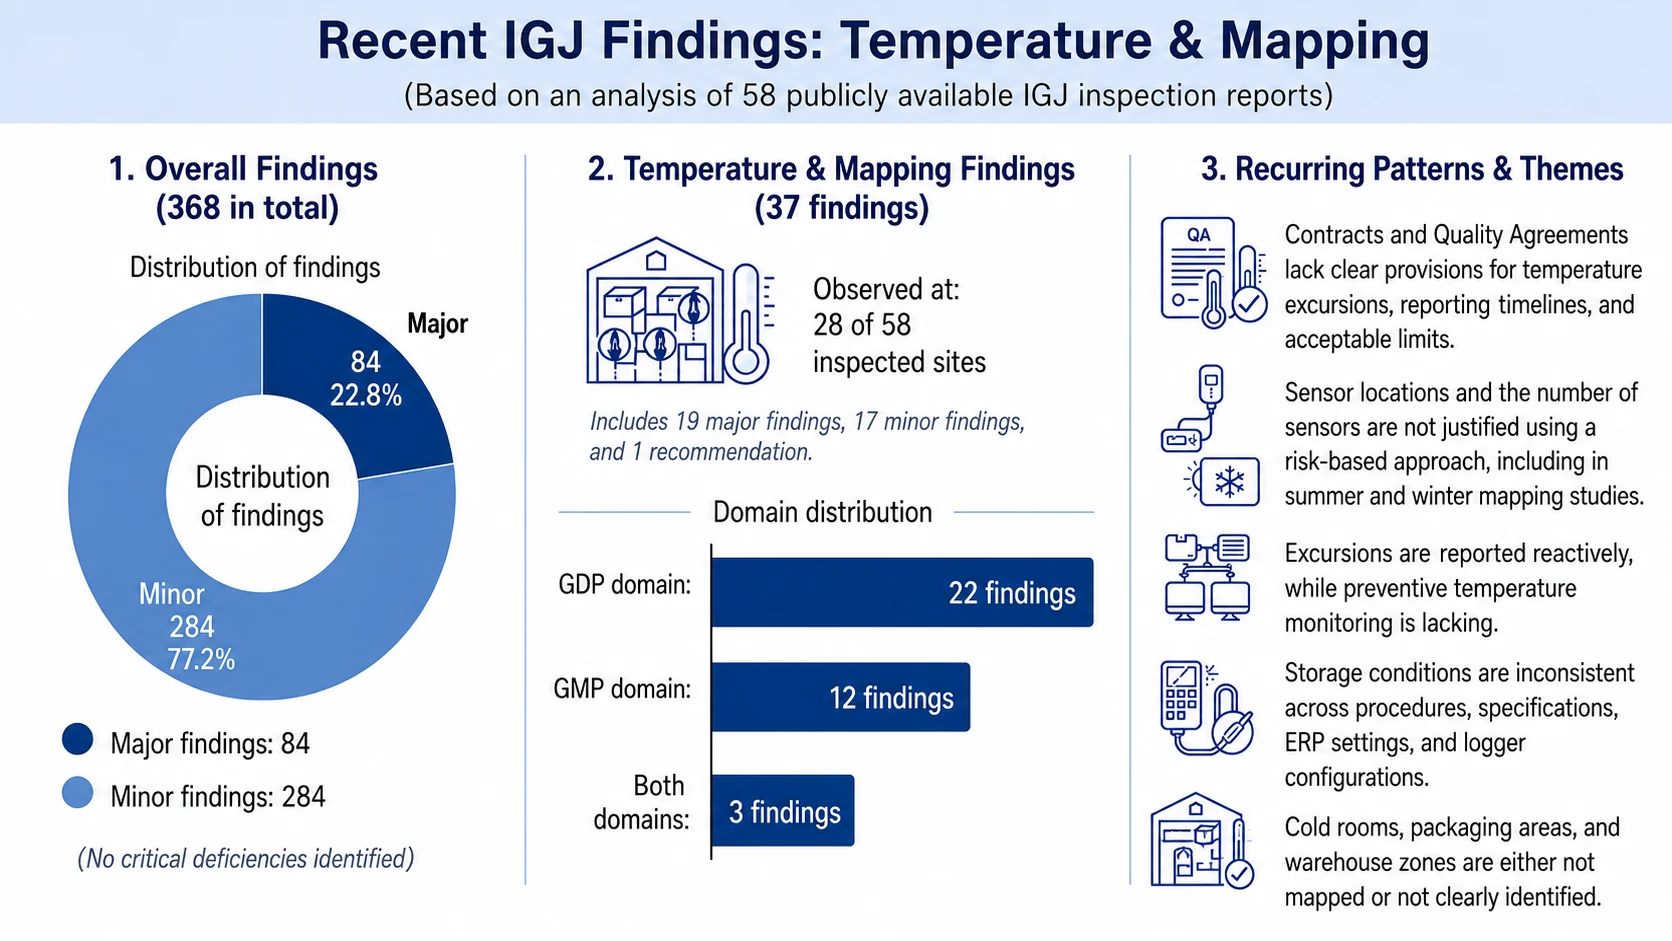
Across the 58 reports, inspectors identified 368 deficiencies, plus 37 formal recommendations. The distribution by severity was:
| Severity | Number |
|---|---|
| Critical | 0 |
| Major | 84 |
| Other (minor) | 284 |
| Total | 368 |
No critical deficiencies were recorded in the dataset, and three inspections reported no deficiencies at all. The largest group concerned the pharmaceutical quality system broadly defined (CAPA, deviations, change control, risk assessments, self-inspection and management review) followed by outsourced activities and contracts, personnel and training, and qualification and validation. After these organisational and system themes, temperature control and mapping form one of the largest technical clusters.
Temperature and mapping highlighted
Thirty-seven findings relate directly to temperature control or mapping: 19 major deficiencies, 17 other deficiencies and 1 recommendation. They occur in 28 of the 58 reports, meaning that almost half of the inspected sites had at least one temperature- or mapping-related issue. Of the 37 findings, 22 fall within GDP, 12 within GMP and 3 within both domains.
The GDP track: mapping, monitoring and contract agreements
For wholesalers and logistics service providers, the temperature issue revolves around three things: has the storage space been properly mapped, is the temperature monitored, and have the agreements about excursions and transport been defined unambiguously?
The classic mapping deficiency (whether the storage area was mapped under representative conditions) appears in several forms. At a large retail wholesaler, inspectors recorded a major deficiency because it was not demonstrable that the initial temperature distribution had been mapped under representative conditions for all storage locations and that temperature-control equipment had been installed.
At another wholesaler, the summer and winter mapping reports did not demonstrate where and how many temperature sensors should be installed
. The quality system therefore contained no defensible rationale for sensor number or location. At a third distributor, the process was inadequately controlled because storage conditions such as 15–25 °C were not defined consistently and correctly.
A second recurring theme is routine temperature monitoring. One wholesale distribution authorisation holder had outsourced transport. The contracted wholesaler reported deviations, but there was no preventive monitoring to ensure that temperature was maintained during storage and transport.
Measuring and reporting after the event is not the same as maintaining control. See also the difference between monitoring and temperature mapping.
The third (and perhaps most frequent) pattern concerns agreements with carriers and storage partners. Excursion limits and reporting timelines were repeatedly absent or ambiguous. One logistics provider’s contract did not state which temperature excursions had to be reported to the contracting wholesaler, or within what timeframe
; a written agreement covering calibration and maintenance of the temperature logger was also missing. Another Quality Agreement required excursion reporting but did not specify the applicable temperature limits
. An active-substance distributor could not demonstrate that the required storage conditions were maintained within established limits during transport.
The GMP track: cold rooms, production areas and data loggers
Manufacturers' attention is shifting from the distribution chain to their own production and storage environment. Mapping is also a theme here. At a manufacturer/repacker the finding was concise: The GMP repackaging area is not monitored for temperature and information about temperature distribution (mapping) is missing.
The configuration and identification of cold rooms and warehouse areas also generated deficiencies. At one manufacturing and logistics site, packaging areas and the cold room were incorrectly identified or not identified by a name or unique number.
At another manufacturer, it had not been assessed whether storage conditions at the starting-material supplier’s warehouse were suitable for all APIs.
A notable GMP issue is the control of data loggers as part of the qualified system. One manufacturer was unaware of potential risks associated with the use of temperature loggers and with connecting these devices to the network.
This concerns both equipment qualification and data integrity. A combined GMP/GDP inspection also showed how monitoring and follow-up intersect: monitoring in production areas was inadequate because no documentation was available to demonstrate that repeated alert-level excursions for low temperature had been communicated in accordance with the procedure.
Examples from the inspection reports
The following anonymised examples show what abstract concepts such as rationale and documented control look like in inspection practice.
| Type of organisation | Domain | What the IGJ found |
|---|---|---|
| Retail wholesaler | GDP | "It is not demonstrable that the initial temperature has been mapped under representative conditions for all storage locations and that temperature control equipment has been installed." |
| Wholesaler | GDP | "The reports of the temperature mapping carried out (summer and winter) do not show where and how many temperature sensors should be placed." |
| Wholesaler | GDP | "The temperature loggers are only placed in the corners of the mezzanine and not at the location where the storage takes place"; hot and cold spots have therefore not been mapped. |
| Logistics service provider | GDP | “The contract with the carrier did not specify which temperature excursions had to be reported to the contracting wholesaler or within what timeframe.” |
| Logistics service provider | GDP | "There was no written agreement with the company responsible for calibration and maintenance of the temperature logger." |
| Pharmaceutical wholesaler | GDP | The Quality Agreement "does not specify which temperature limits apply to each drug product, nor how long a drug product may be out of storage conditions." |
| Pharmaceutical wholesaler | GDP | A definition of "significant temperature alarm" and "significant temperature excursion" is missing in the contract; the basis for the excursion windows could not be shown. |
| Pharmaceutical wholesaler | GDP | “Although temperature deviations are reported by the contracted wholesaler, no preventive monitoring takes place to ensure that temperatures are maintained during storage and transport.” |
| Distributor of active substances | GDP | Cannot "demonstrate that the required storage conditions for the active substance are maintained within the established limits during transport." |
| Manufacturer / repacker | GMP | "The GMP repackaging area is not monitored for temperature and information about temperature distribution (mapping) is missing." |
| Manufacturer | GMP | "The packaging areas and cold room are not correctly identified or not identified with a name/unique number." |
| Manufacturer | GMP | The company was “unaware of the potential risks associated with using temperature loggers and connecting these devices to the network”. |
All 37 temperature- and mapping-related findings, anonymised and organised by organisation type, domain, theme and cited guideline. Useful for an internal QA review or gap assessment.
Request the full list of findingsHow to implement temperature mapping properly
Five recurring patterns emerge from the 37 findings. Together, they provide practical review points for any GMP- or GDP-regulated organisation.
- Justify your mapping, not merely its execution. Completing a study is not enough. Inspectors expect a documented rationale for the number and location of measurement points, based on risk and representative conditions, plus a report that identifies the hot spots and cold spots.
- Make temperature monitoring preventive, not reactive. Only reporting excursions afterwards is insufficient; the inspectorate expects active, preventive monitoring that ensures that the temperature remains within the limits.
- Define excursion limits and notification requirements in contracts. The most frequent weakness lies not in the technology but in the documentation: which temperature limits apply, which excursions must be reported, to whom, within what timeframe and who is responsible for each activity.
- Ensure that storage conditions are clearly and correctly recorded. Several findings indicate that storage conditions (such as 2 to 8 °C or 15 to 25 °C) are not consistently stated in procedures and documentation, and that cold rooms and warehouse areas are not clearly designated and identified.
- Treat data loggers as qualified, maintained equipment. Calibration, maintenance and the risks associated with connecting the loggers to the network should be explicitly covered, including an agreement with the service provider responsible.
These five patterns have one feature in common: temperature deficiencies rarely concern a defective cold room or an actual excursion. They far more often concern the documented state of control: is the process described, justified, contractually defined and demonstrable? This reflects the broader finding that the quality system accounts for the largest cluster of deficiencies. Documentation is often the weak link in temperature control as well.
This is where Temperature Mapping Europe can help. A sound protocol, risk-based placement of calibrated data loggers and an inspection-ready report address most of the weaknesses identified in this analysis. Robust mapping and documented control make inspections easier to navigate and, more importantly, protect product quality. Compare our three service levels or create an initial 3D measurement-point proposal.
Methodology and sources
This analysis is based on 58 publicly available final reports from the Dutch Health and Youth Care Inspectorate (IGJ), covering inspections conducted between 26 June 2024 and 23 April 2026. Deficiency counts follow the inspection teams’ own classifications of critical, major and other. Each deficiency was assigned to a theme and to the GMP or GDP domain using its cited EU reference and finding text. All 37 temperature- and mapping-related findings were recorded and verified. Quotations were anonymised and translated from Dutch; redacted confidential passages were omitted or paraphrased.
Read more
Continue with the guidelines for temperature mapping, what auditors want to see, how many measurement points are required, when requalification is appropriate and what belongs in a mapping dossier.