GDP temperature mapping for warehouses and wholesalers

Facing a GDP inspection, a customer audit, or a new warehouse or cold room? A temperature mapping study by Temperature Mapping Europe gives you the audit-ready substantiation that inspectors and MA-holders expect, for your 15-25 °C storage, 2-8 °C cold rooms and API zones.

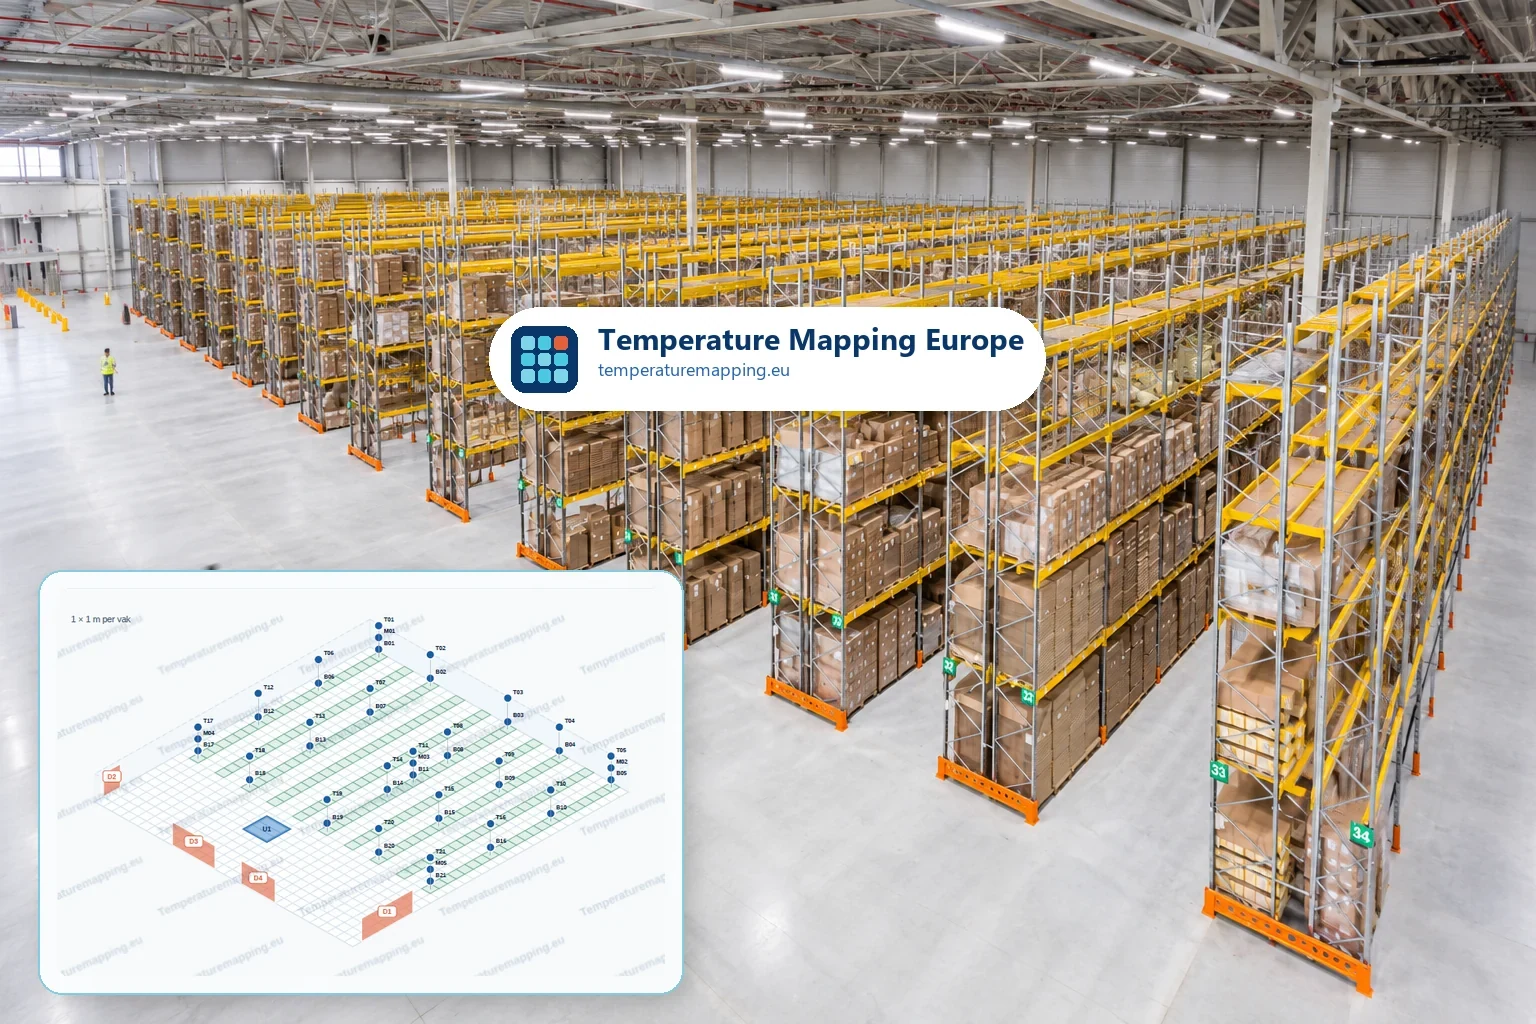
GDP warehouse temperature mapping study, showing a high-bay pharmaceutical warehouse with an isometric 3D floor plan of data logger placement (top, mid and bottom sensors per rack column) used to map hot spots and cold spots.
In brief

GDP temperature mapping is a documented study that measures whether every product location in a warehouse or cold room stays within its required temperature range, typically 15-25 °C or 2-8 °C, over a representative period including seasonal extremes. The study identifies hot and cold spots, justifies where fixed monitoring sensors should be placed, and produces the qualification dossier that GDP inspectors and MA-holders expect.

Three questions a GDP inspector will ask about your storage

A mapping study is not documentation for its own sake. It exists to give you a defensible answer to the three questions that come up in almost every GDP inspection of a warehouse or cold room.

"Why are your monitoring sensors placed exactly there?"

Without mapping, sensor positions tend to be chosen by convenience: near a door, on a pillar, wherever the cable reached. A mapping study replaces that with data. The sensor sits where the hot or cold spot actually is, and you can show the graph that proves it.

"How do you know the summer worst case is covered?"

A single week of measurement in October says little about August. GDP expects representative conditions, which for most European warehouses means a summer campaign and a winter campaign, or a documented justification for why one season is enough.

"What happens when the cold room door opens during a delivery?"

Cold rooms recover after a door movement, but how deep the excursion goes and how long recovery takes depends on load, product height and airflow. Mapping quantifies this and translates it into the excursion limits your monitoring alarms should use.

Test your own file against the auditor's questions

The three questions above are just the start. Our free audit-readiness check runs your temperature-mapping and monitoring documentation past the control points that GDP and GMP auditors actually raise, tailored to your room type: warehouse, cold room, freezer or refrigerator. In five to ten minutes you receive a PDF report showing where your file is strong, and where an inspector might raise a finding.

Grounded in EU GDP, GMP Annex 15, WHO and ISPE, plus 37 concrete findings from 58 Dutch IGJ inspection reports.

Audit-readiness check for GDP temperature mapping: PDF report showing document strengths and gaps against auditor control points

Three levels: from renting loggers to full on-site execution

The mapping study is the same. What differs is how much your team performs, and how much we take over. Pick the level that fits your internal capacity and audit risk appetite.

LevelYour teamTemperature Mapping EuropeWhat we deliver
  1. Level 1€299
    Calibrated data loggersYou handle mapping, protocol and dossier
  2. Level 2€599
    + Protocol upfront and analysis report afterYour team places the loggers and runs the measurement
  3. Level 3€999
    + Complete on-site executionYou provide site access and product context

Loggers ship as a plug-and-measure case with calibration certificates. See what is in the case.

View all pricing and service levels

Carried out with expertise from pharma and distribution

At Temperature Mapping Europe, your project is handled by people with real industry experience. Our approach is technically sound, but above all focused on what is needed in practice to assess and substantiate storage conditions properly.

Practical EU-GMP/GDP experience

We have extensive hands-on experience in quality management within EU-GMP/GDP environments for pharmaceutical manufacturing and distribution. This experience includes serving as a Responsible Person / Designated Person and leading validation and qualification programmes in highly regulated environments.

Practical and risk-based

The people assessing your space come from industry. They understand both the guidance and how temperature mapping is assessed in practice by QA, auditors and inspectors.

Vendor-neutral

Temperature Mapping Europe is an independent company, not a manufacturer, distributor or label of any equipment supplier. We sell no monitoring systems of our own and choose data loggers on a brand-neutral basis. Our approach follows ISPE, WHO, GDP, GMP and HACCP guidance, independent of any supplier.

Personal approach

The same person helps define the measurement setup, assesses the space, processes the data and writes the report. That gives you short lines, fast planning and one fixed point of contact.

Temperature Mapping Europe office setting.

Arranged quickly. Soundly substantiated.

What gets measured, and how much of it

The number of loggers, the study duration and the risk zones depend on which temperature range applies to your product. Below is the typical scope for GDP storage; the exact plan is set in the mapping protocol, on a risk-based rationale per WHO TRS 961 and ISPE GPG.

15-25 °C

Warehouse and storage area

For medicinal products and APIs at controlled room temperature. Typical scope for a European GDP warehouse: a grid of loggers every 5 to 10 metres, at multiple heights across the working height, over at least a full measurement week per season. Larger facilities easily reach dozens of measurement points.

  • Warmest and coldest product locations at floor, mid and top-rack level
  • Solar load on external walls and roof, plus HVAC recovery after loading peaks
  • Summer campaign or documented justification for a single season
  • Justified fixed monitoring position based on the actual worst case
2-8 °C

Cold room and refrigerated storage

For refrigerated medicinal products and samples. Typical scope for a walk-in cold room: 9 to 15 measurement points depending on volume, with extras at the door and near the evaporator, over at least a full measurement week with a representative delivery pattern.

  • Hot and cold spots near evaporator, doors and product height
  • Door-open excursions and recovery time under real loading
  • Impact of defrost cycles and airflow at pallet edge
  • Conclusion per product location, with monitoring sensor recommendation

How the number of measurement points is decided

Each GDP location has its own risks

Measurement points are selected based on product locations, airflow, doors, height differences and existing temperature data.

LocationWhat does mapping assess?Typical output
GDP warehouseRacks, external walls, supply and return air, loading level and solar load.Assessment of whether all product locations remain within 15-25 °C or product-specific limits.
Cold roomDoor zone, evaporator, product height, loading and recovery after door movements.Justified 2-8 °C product zones and monitoring position.
DispatchTemporary storage, open doors, seasonal influence and loading moments.Insight into temporary exposure and required procedural controls.
QuarantineSeparate storage zones, lower air circulation and different loading.Assessment of whether unreleased products are also stored appropriately.
API storageProduct locations, packaging format, temperature limit and audit question.Qualification substantiation for GDP/GMP interfaces and supplier qualification.

What does the dossier contain?

A GDP mapping dossier should make it clear why the study design was logical, what the data show and how routine monitoring follows from the results.

"Placing the loggers ourselves and still receiving a fully substantiated dossier was exactly what we needed. Everything was arranged at short notice."
Operations manager, pharmaceutical distribution

See what a mapping dossier contains

Mapping protocolScope, duration, interval, conditions and acceptance criteria.
Risk assessmentJustification of critical locations, use and measurement points.
Measurement planRationale per logger position, including product locations and worst-case points.
Data and graphsRaw data, trends and summary per measurement point.
Hot/cold-spot analysisAssessment of temperature extremes and monitoring sensor advice.
ConclusionSuitability of warehouse or cold room, including recommendations and certificates.

See a measurement-point proposal for your own space

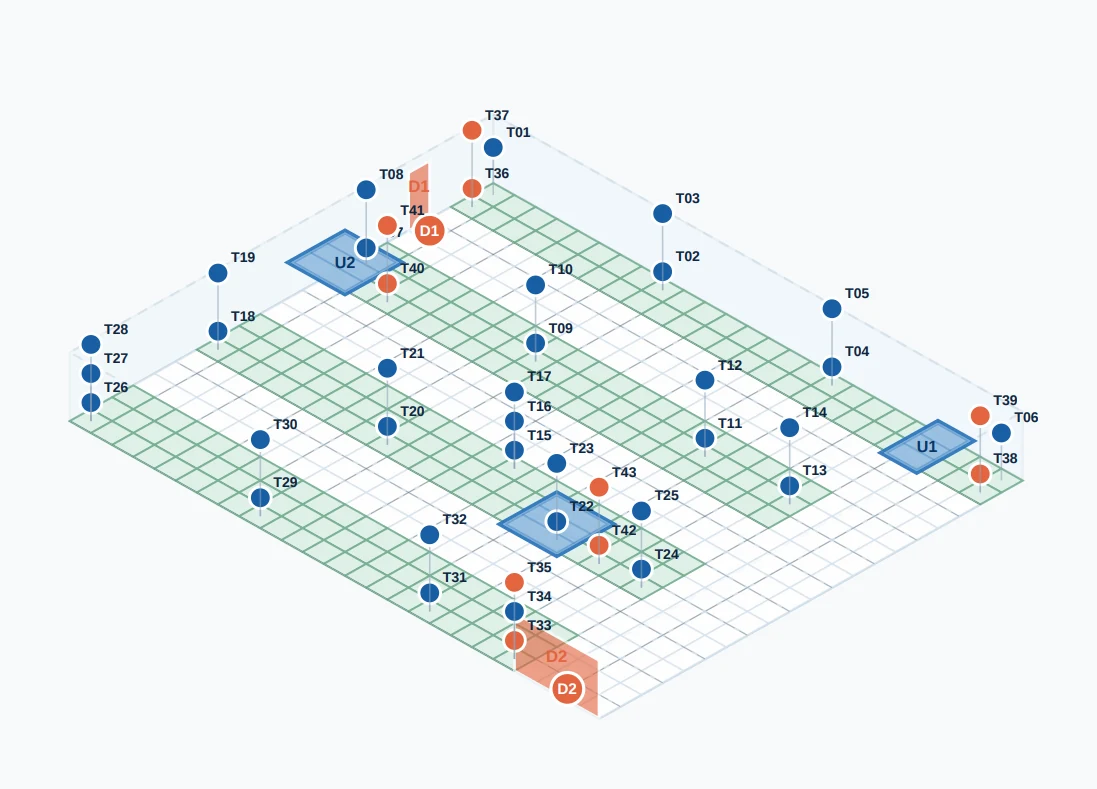
Before requesting a quote, use the free 3D mapping tool to sketch your warehouse or cold room. You get a proposed sensor layout, an estimated number of loggers and a first indication of the study scope, so the consultation starts with a concrete picture instead of a blank sheet.

3D measurement-point layout from the temperature mapping tool, for a GDP warehouse

When to use mapping?

Mapping is especially useful when temperature control must be demonstrable or when the situation has changed.

New warehouse or cold roomChange to HVAC, racks or layoutPreparation for inspection or customer auditSubstantiation of monitoring locationsSeasonal requalificationTemperature deviations or doubts about existing monitoringExpansion of GDP activitiesQualification of API storage

Request advice for your GDP warehouse

Frequently asked questions

What does GDP temperature mapping for warehouses and wholesalers involve?
GDP temperature mapping is a documented study that measures whether every representative product location in a warehouse or cold room stays within its required temperature range, typically 15-25 °C or 2-8 °C, over a representative period including seasonal extremes. The study identifies hot and cold spots, justifies where fixed monitoring sensors should be placed, and produces the qualification dossier that GDP inspectors and MA-holders expect.
Is temperature mapping required for GDP?
Yes. EU GDP guidelines (2013/C 343/01, section 3.2.1) require that storage areas for medicinal products are qualified for the required temperature conditions, and temperature mapping is the standard method to demonstrate this. GMP Annex 15 sets the same qualification expectation for manufacturing environments. In practice, wholesalers, API distributors and pharmaceutical manufacturers should be able to show a mapping dossier during any GDP or GMP inspection or customer audit.
Where should the fixed monitoring sensor be placed after temperature mapping?
The fixed monitoring sensor is typically placed where the mapping data identified the hot or cold spot, so routine alarms trigger before any product location goes out of specification. In some cases another position is justified by the mapping data, for example when worst-case alarming is already covered elsewhere or when a representative average point better reflects normal operation. The point is that the choice is data-driven and documented, not chosen by convenience.
Does GDP temperature mapping need to cover both summer and winter?
For 15-25 °C warehouses, yes in most cases. A single week of measurement in October says little about August. GDP expects representative conditions, which in line with WHO TRS 961 guidance normally means a summer campaign and a winter campaign, or a documented justification for why one season is enough. For 2-8 °C cold rooms the compressor holds the temperature more stably, so seasonal impact is smaller and one campaign may be sufficient.
How does opening a cold room door affect temperature mapping results?
Cold rooms recover after a door movement, but how deep the excursion goes and how long recovery takes depends on load, product height and airflow. Mapping quantifies this and provides evidence for how excursion limits and recovery expectations should be set for routine monitoring alarms.
Which support levels are available for GDP temperature mapping?
Temperature Mapping Europe offers three fixed-price levels. Level 1 (from €299) is self-measurement with rented calibrated data loggers, for teams that already have their own protocol. Level 2 (from €599) means we prepare the measurement protocol beforehand and deliver the analysis report with the mapping data afterwards, while your own team places the loggers and runs the measurement. Level 3 (from €999) is complete on-site execution, where the mapping is performed, analysed and documented for you.
How much does GDP temperature mapping cost?
GDP temperature mapping cost depends on the number of measurement points, the study duration and how much of the work you take on internally. Temperature Mapping Europe offers three fixed-price levels: from €299 for calibrated logger rental, €599 for a measurement protocol upfront and an analysis report afterwards with your team running the measurement, and €999 for complete on-site execution. These prices are typically well below what larger consultancies quote for the same scope, because we work as a focused specialist team without agency overhead.
When is temperature mapping for a GDP warehouse useful?
Mapping is used for a new warehouse or cold room, after a change to HVAC, racking or layout, when preparing for a GDP inspection or customer audit, to substantiate monitoring positions, for seasonal requalification, after temperature deviations, when expanding GDP activities, and for qualification of API storage.