Why the season changes your results
At heart, a warehouse is a big box exposed to the weather. On a sunny day the roof can reach well over 50 °C, and that heat radiates straight down into the top rack levels. In winter the same building loses heat through its walls and floor, and every time a dock door opens, cold air floods into the nearest storage positions.
Many large warehouses have little to counter this with. Some have a full HVAC system, but plenty rely on a few heaters, destratification fans or simply the insulation of the building itself. The less active climate control there is, the more directly the outside weather shows up inside.
As a result, one storage area can have two quite different temperature profiles: one on hot days and one on cold days. A single mapping in a mild month captures neither. It shows how the building behaves when the weather is kind, which is exactly when you least need to know.
Where there is equipment, the seasons also change how it runs. Heaters that sit idle all summer only reveal their weak spots in January, cooling units work hardest during a heatwave, and the airflow pattern changes as soon as a system switches from cooling to heating.
Which storage areas need seasonal mapping?
Not every space needs two studies. The key question is simple: can outdoor conditions affect the temperature around the product? Use the table below as a practical starting point.
| Storage area | Seasonal mapping? | Why |
|---|---|---|
| Ambient warehouse (15–25 °C) | Usually yes | Solar gain through the roof, heat loss through the walls and open dock doors change the profile between summer and winter. |
| High-bay warehouse | Yes | Temperatures can stratify over the full rack height in both seasons: heat builds up under the roof in summer, while cold floor zones appear in winter. |
| Ambient storeroom inside a climate-controlled building | Often one, if justified | No direct outdoor exposure, but check for windows, radiators and adjoining unheated spaces. |
| Small room-temperature storeroom (a few m²) | Risk assessment | A radiator, a window or a sunny wall can be enough to create a seasonal risk. |
| Cold room or freezer room inside the building | Usually not | The surrounding space is controlled, and continuous monitoring will reveal any seasonal effect. |
| Cold room against an external wall or in an unheated hall | Consider it | Summer heat on the condenser or the room panels can push the refrigeration unit to its limits. |
| Fridges and freezers | Not for the unit itself | Do check the room they stand in: a fridge in an unheated storeroom can struggle in winter. |
| Refrigerated vehicles and shipping lanes | Yes | Outdoor extremes act directly on the load, so summer and winter profiles are part of the qualification. |
Where hot and cold spots move between seasons
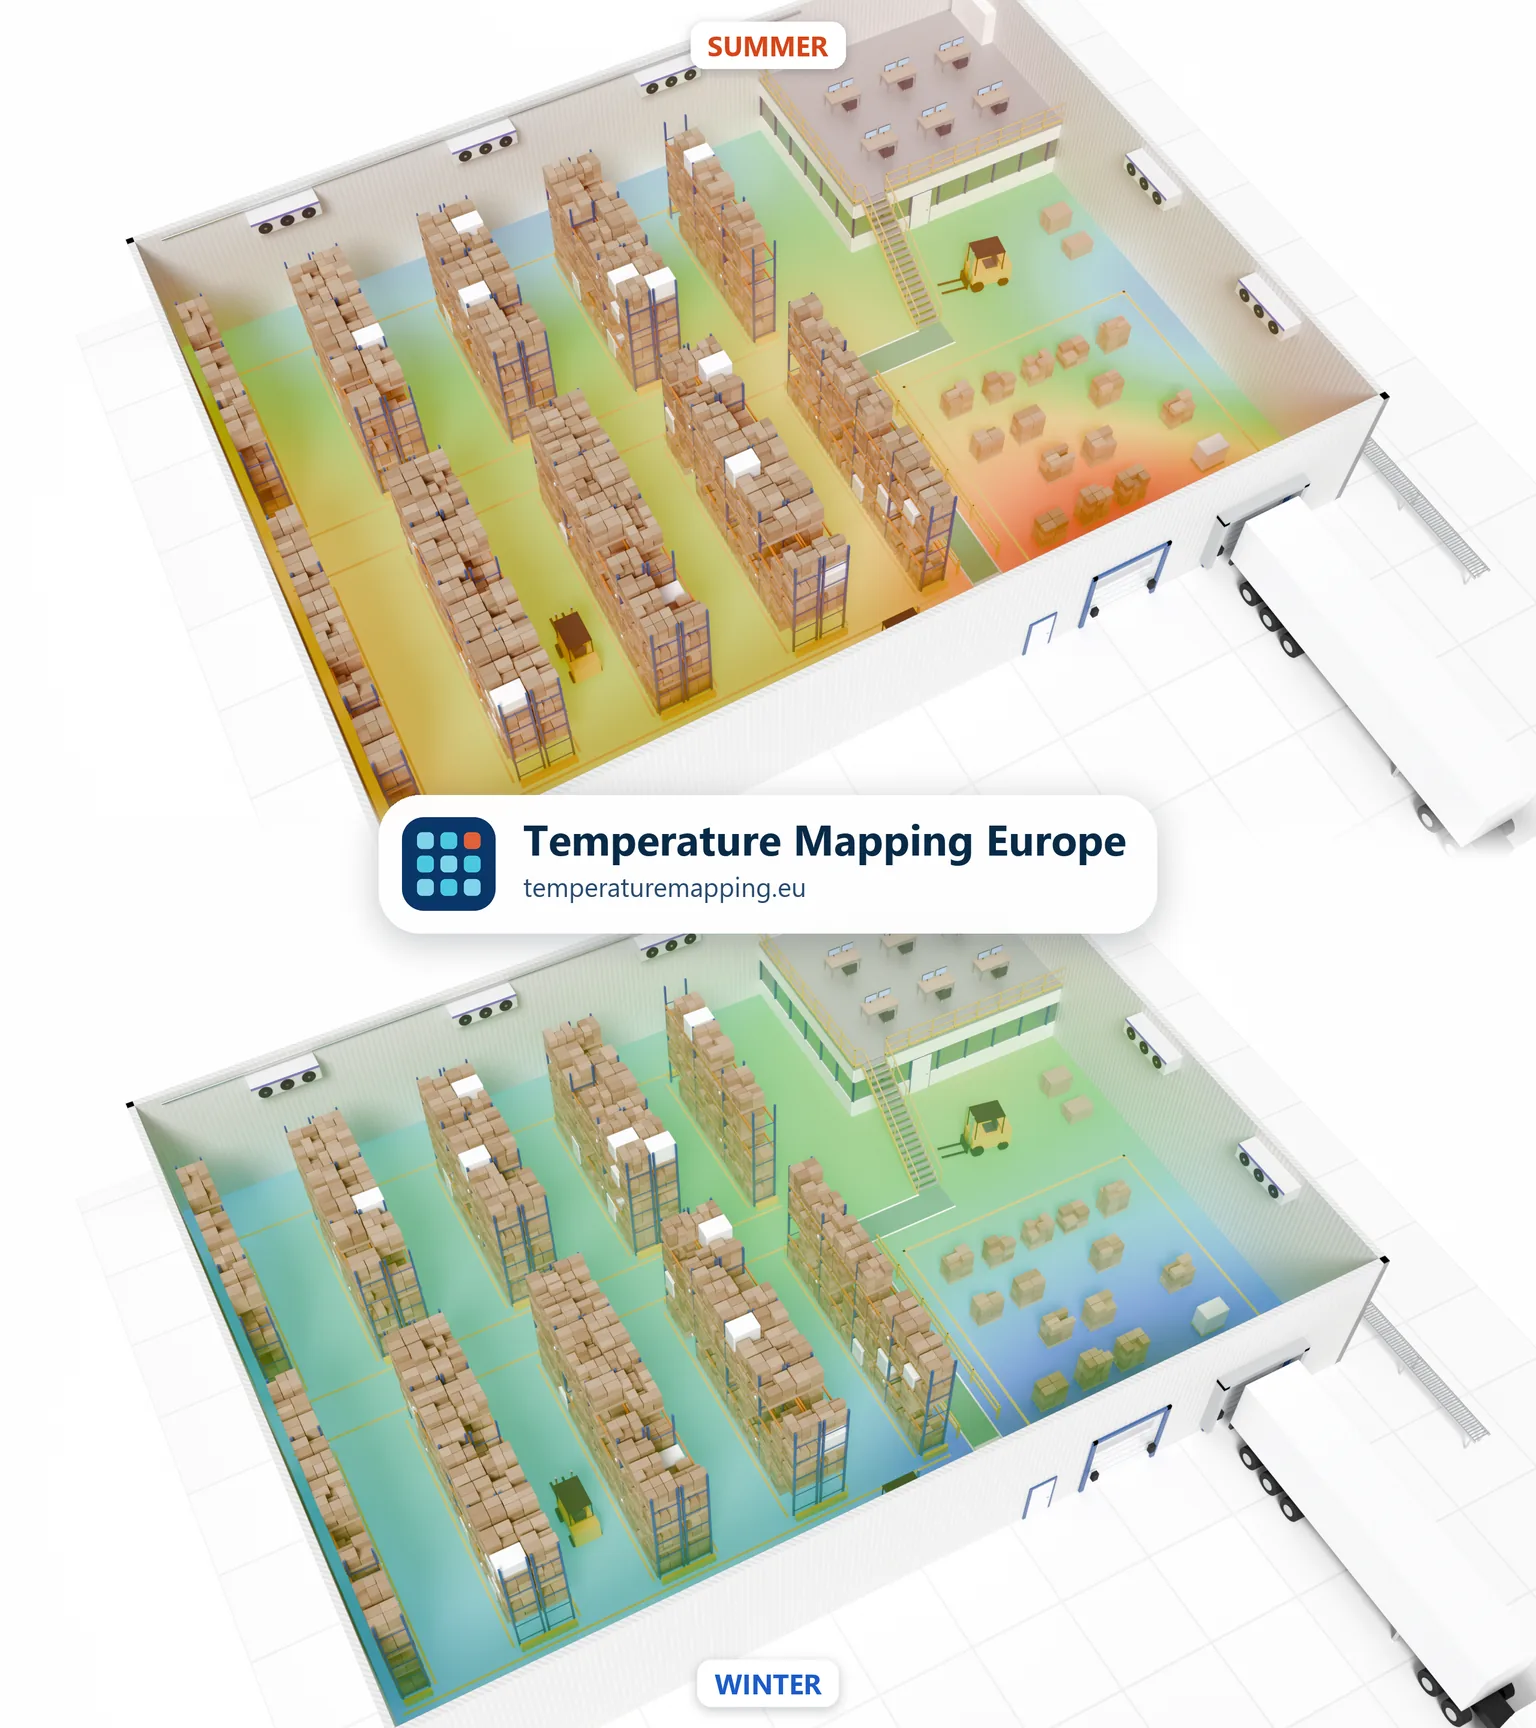
This is where seasonal mapping really pays off. The warmest position in July is rarely the coldest position in January, so a monitoring sensor positioned on the basis of summer data alone can miss the winter risk entirely.
| Zone | Summer | Winter |
|---|---|---|
| Top rack levels under the roof | A typical hot spot, due to solar gain and rising warm air. | Often still the warmest point, as heated air collects under the roof. |
| Floor and bottom pallet positions | Often the coolest part of the building. | Likely cold spot, especially on uninsulated floors. |
| Storage positions near the dock doors | Warm air floods in whenever the doors are open. | Cold air floods in; often the lowest readings in the storage area. |
| South- and west-facing walls | Warm perimeter zones in the afternoon. | Little effect. |
| North-facing walls | Little effect. | Cold perimeter zones, especially behind racking with poor airflow. |
| Near heaters or cooling units | Cold draughts from cooling units. | Hot air from heaters; stock placed too close can exceed the upper limit. |
How to plan the two studies
Pick the right weeks
Run the summer study in the warmest part of the year and the winter study in the coldest. In most of Europe that means roughly July–August and January–February. Keep an eye on the forecast: a study that captures a heatwave or a cold snap is far more convincing than one carried out in a mild, overcast week. Set out in the protocol what counts as representative summer and winter conditions before you start, for example based on local weather statistics or the design conditions of the building. That way there is no debate afterwards.
Measure for long enough
For warehouses and other ambient storage areas, the usual minimum is seven consecutive days: five working days and a weekend. That way you capture the day-night cycle, busy working days with the docks open and quiet weekends with the doors shut.
Log the outdoor temperature
Place one extra logger outside, in the shade, or use data from the building management system or a nearby weather station. This reading is for information only and is not assessed against your acceptance criteria. Without it, you cannot show that your "summer mapping" really took place in summer conditions. It also helps you explain peaks in the data: was it the weather, or a door left open?
Use the same logger layout both times
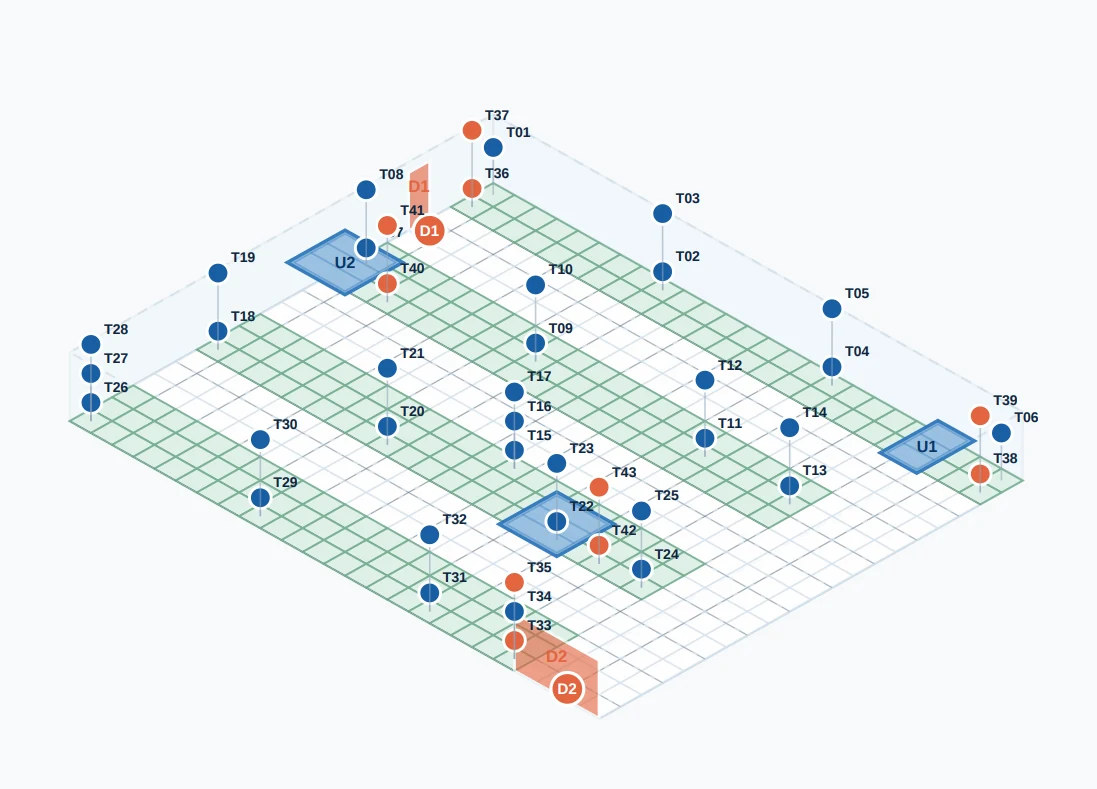
Summer and winter results can only be compared if the logger positions are identical. Number every position, photograph it and reuse the same plan. You can add positions for the second study, but never move the original ones.
Keep conditions realistic
Map with normal working hours and normal door use. For warehouses, both the empty and the fully loaded state are worst cases worth covering: racking full of stock blocks airflow, while an empty store has little thermal mass to buffer temperature swings. Leave heaters, fans and cooling units on their usual seasonal settings, so you measure the building the way it actually operates. If there are duty and standby units, make sure each one runs on its own for part of the study.
Two seasons, one plan
Need loggers for a summer and a winter study? We rent out calibrated loggers across Europe and can supply the same set for both studies, so every position is measured with the same logger.
View logger rentalWhat if your warehouse opens in spring?
New sites rarely go live right at the start of a heatwave. That is not a problem, as long as you plan for it:
- Map before go-live, whatever the season, and use the results to release the area and set the initial monitoring positions.
- Schedule the first seasonal study for whichever extreme comes first, and the opposite season within the first year.
- Bridge the gap with extra monitoring sensors at the expected worst-case positions: top racks under the roof, storage positions near the dock doors and racking along external walls.
- Consider the load: a new warehouse is rarely full in its first few months, so you can use a later seasonal study to cover the fully loaded state as well.
A spring or autumn mapping does not replace either seasonal study. It is a useful baseline, but it will not show you the worst case.
Mapping continuously for a full year is sometimes suggested as an alternative, but in practice we do not recommend it. A year-long study means keeping a full set of loggers in place for twelve months, managing calibration intervals along the way and reviewing a year's worth of data from every position. Two well-timed studies, one in summer and one in winter, capture the same worst cases with far less effort and give you a clearer, more manageable dossier.
Comparing summer and winter results
The real value of seasonal mapping lies in the comparison, not in two separate reports. In the final assessment, look at:
- Minimum and maximum per position in both seasons. Which positions are extreme in summer, which in winter, and which in both?
- Trends, not just individual peaks. A position that is consistently warm is a more meaningful hot spot than one that spiked once because a door was left open.
- Seasonal versus one-off effects. Separate what the weather did from site-specific events, such as a pallet blocking a fan or a maintenance visit.
- Monitoring positions. Position permanent sensors so they cover both the summer hot spot and the winter cold spot. That often means at least two positions, not one.
- Margins. How close did the worst position come to the limit? A reading of 24.6 °C in a mild summer is a warning sign, not a comfortable pass.
Can you skip one of the seasons?
Yes, but only with a written, approved rationale. A single mapping can be justified when:
- the area is fully enclosed within a climate-controlled building, with no roof or external walls exposed to the weather;
- the area has active climate control with enough capacity for local summer and winter extremes, and commissioning has proven this;
- there are enough monitoring sensors, in the right places, to pick up any seasonal effect straight away, so monitoring effectively acts as continuous mapping;
- the site is in a temperate climate where outdoor extremes are rare and short-lived. ISPE gives a useful yardstick: be concerned when outdoor conditions exceed normal operating conditions by more than 6 °C for more than three hours.
Record this reasoning in your risk assessment and have it approved by QA and the system owner. Inspectors rarely object to a single mapping; they do object to a single mapping without a rationale.
Common mistakes
- Mapping in May or September and calling it a summer or winter study.
- No outdoor reference logger, so the seasonal conditions cannot be proven.
- Moving logger positions between the two studies, which makes the results impossible to compare.
- Positioning the monitoring sensor on the basis of summer data only, and missing the winter cold spot.
- Spreading loggers evenly over the floor plan, including aisles and areas where no stock is ever stored, instead of focusing on the actual storage positions.
- Only ever mapping the warehouse empty, so the effect of full racking on airflow is never tested.
- Skipping a season without a documented rationale.
What the guidelines expect
The regulatory texts on this are brief. EU GDP requires mapping under representative conditions and monitoring sensors at the points with the greatest fluctuations, and it explicitly mentions seasonal variation for transport. The WHO technical supplement on mapping storage areas recommends a study in both the warmest and the coldest season for areas affected by seasonal changes, noting that this is typically not needed for cold rooms and freezer rooms. ISPE adds the practical detail: base the decision on a risk assessment, and plan a supplementary study in the opposite season within the first year. The rest of this article is about turning those principles into a mapping that holds up in practice.
Not sure whether your storage area is affected by the seasons? We can review your layout and monitoring data and advise whether one or two studies are justified.
Sources used
- EU GDP Guidelines 2013/C 343/01, section 3.2.1 (temperature mapping and monitoring positions) and chapter 9 (seasonal variation in transport).
- Dutch Health and Youth Care Inspectorate (IGJ), FAQ on wholesale licences and GDP, version 9, questions on study duration and summer and winter mapping.
- WHO Technical Report Series No. 961, Annex 9, Supplement 8: Temperature mapping of storage areas (2015).
- ISPE Good Practice Guide: Controlled Temperature Chamber Mapping and Monitoring, guidance on seasonal testing.
- ISPE Good Practice Guide: Cold Chain Management, guidance on seasonal profiles for cold chambers and shipping.